Published August 18, 2020
Alexander Norbash
2020–2021 ARRS President
Do you believe that a radiologist deserves to comment on social inequities in a column such as this? Today, I believe that it is appropriate for me to do so. I do believe that, as a physician, I have a perspective that allows me to have an informed opinion where public health is concerned. And I believe that inequity, poverty, and racism are all public health problems. Whether or not they are solvable is beyond my understanding, given the human condition and history. If you feel that I have no right opining on such as this, I pray that you will forgive me this deviation.
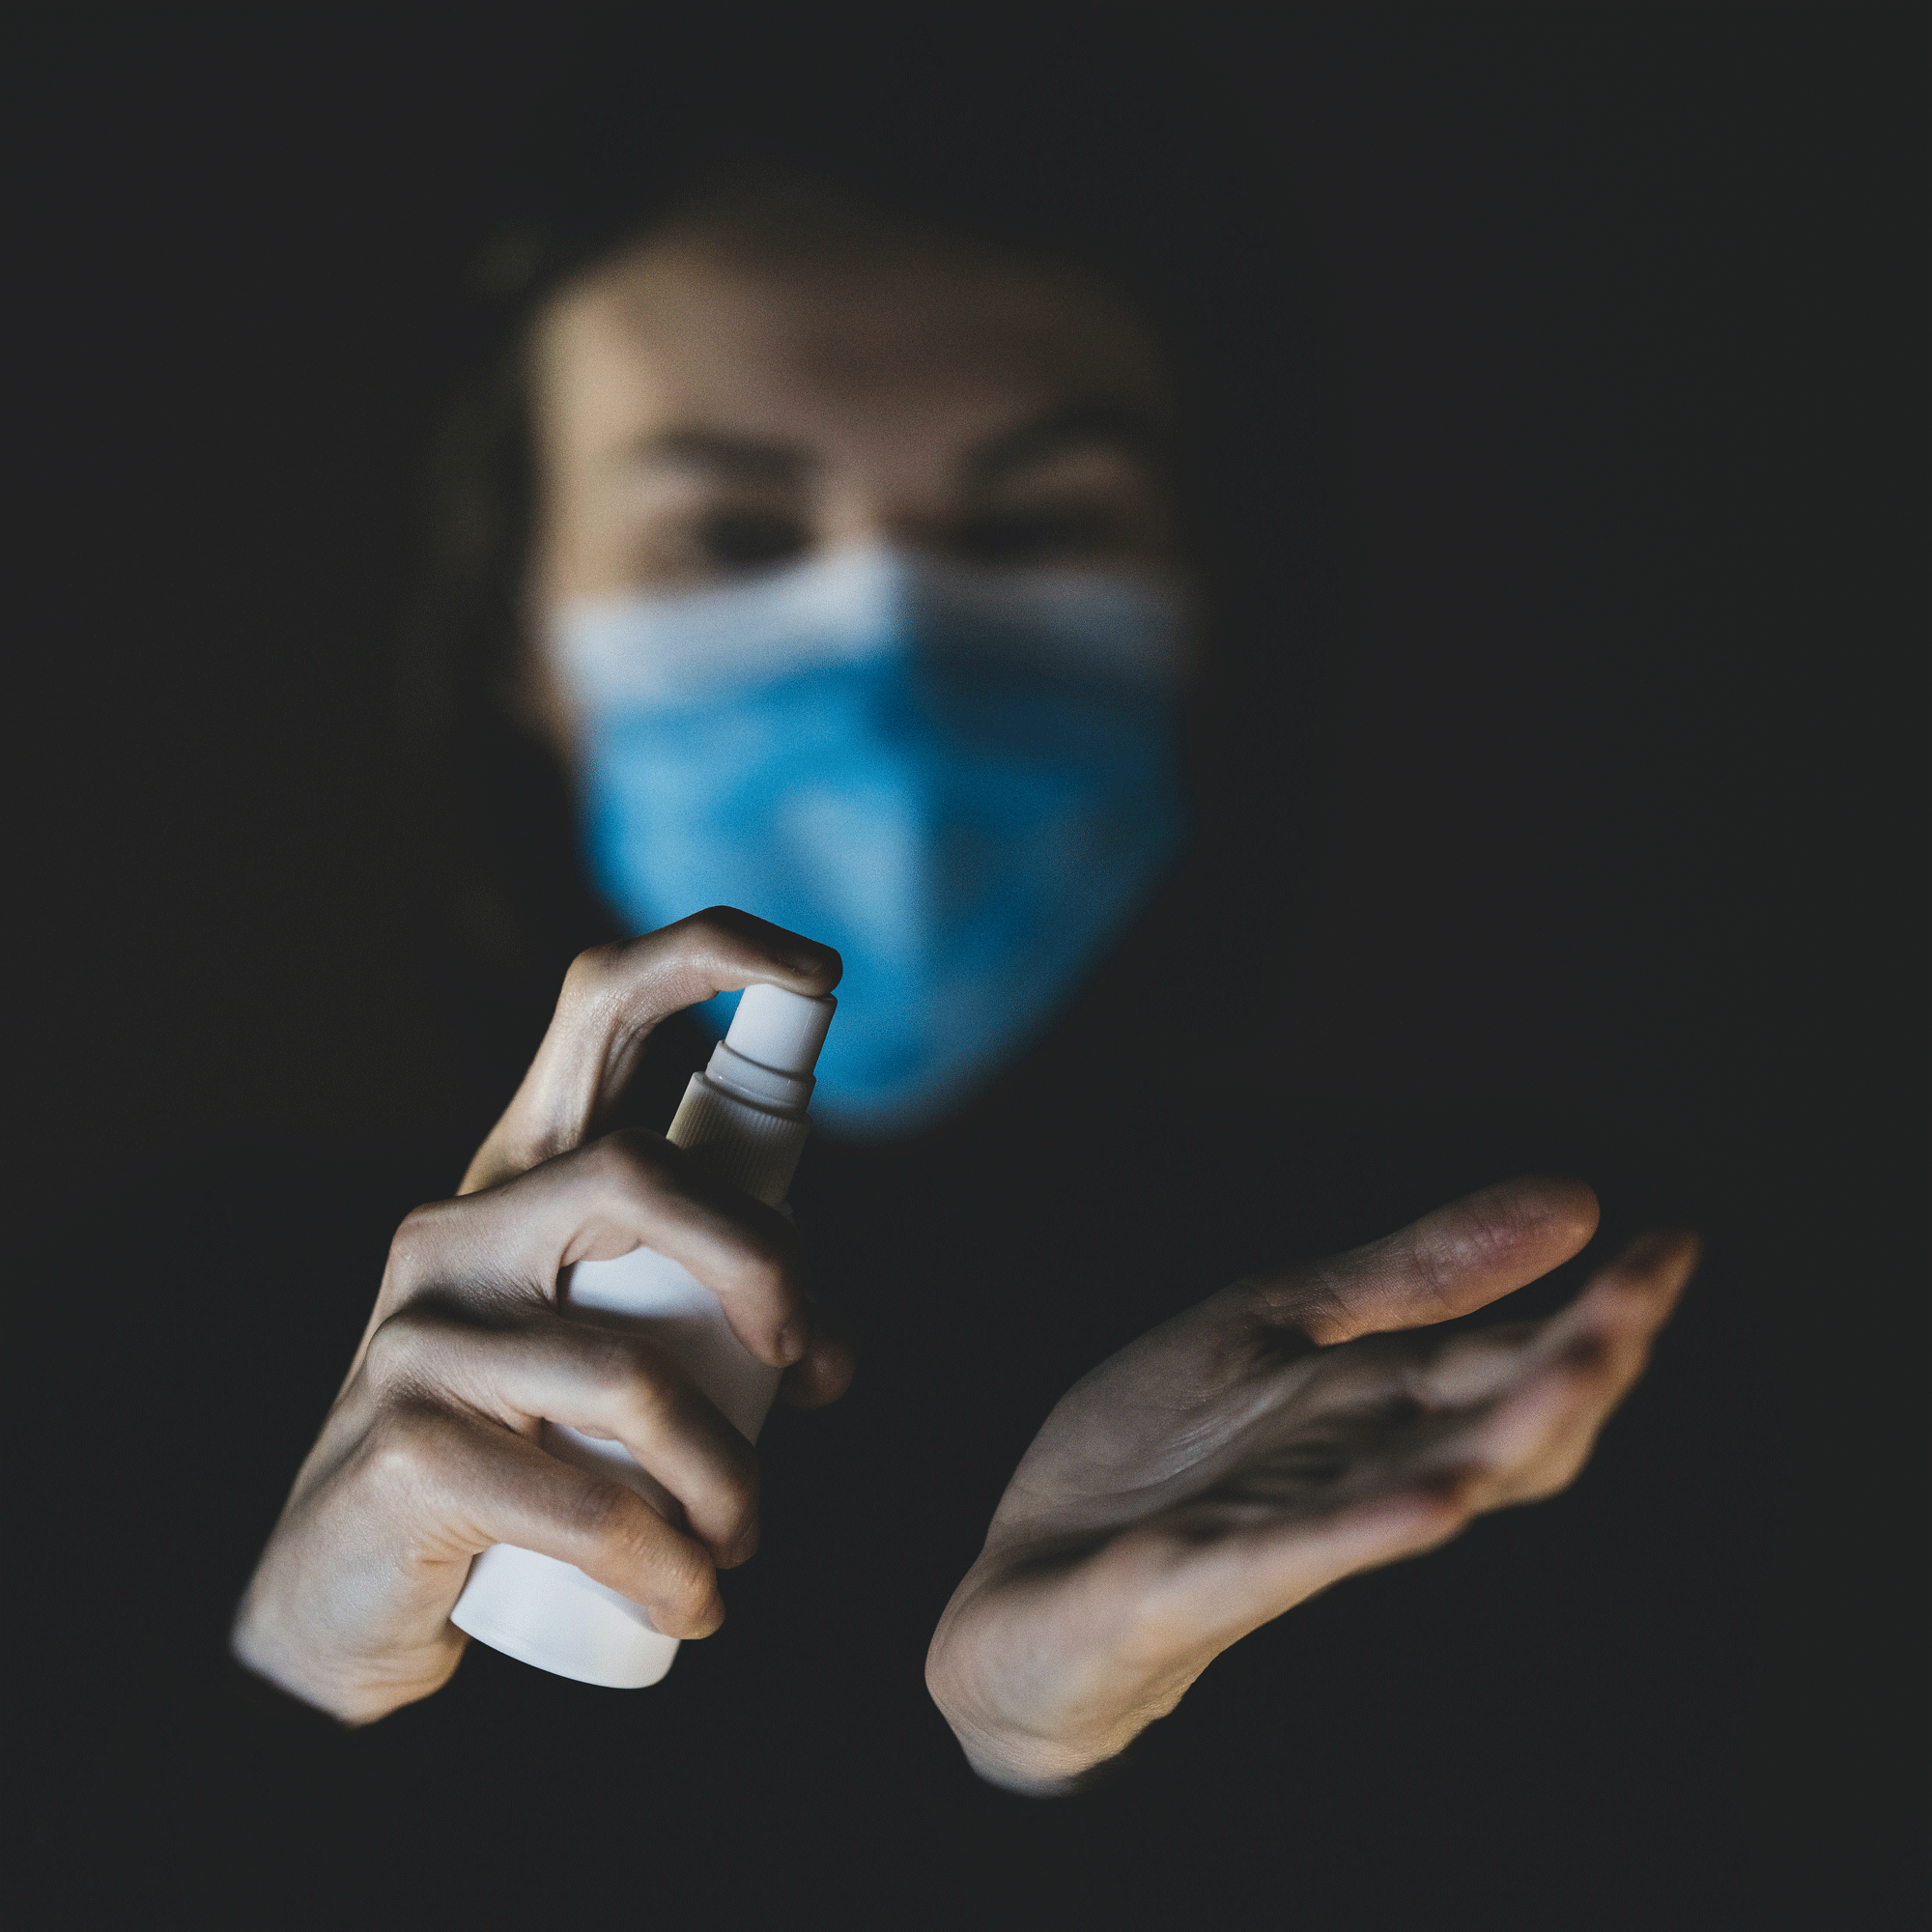
On Thursday, April 9, I sent my last editorial to our InPractice editor. At the time, the focus of my thoughts dealt with the COVID-19 crisis and all that we saw, anticipated, and feared at the time as a direct result. I thought we were facing a once-in-a-lifetime problem that would demand our full attention, cost us many lives and considerable hardships, and might take two or three years to address. I even assumed at the time that we would be facing some type of large-scale societal financial crisis, above and beyond the imminent financial crisis I thought our health system would be facing. We thought we would figure this out. I did not imagine I would see a bigger crisis than COVID in my time, and I certainly could not imagine my commenting on a bigger crisis in my three remaining editorials. I was mistaken.
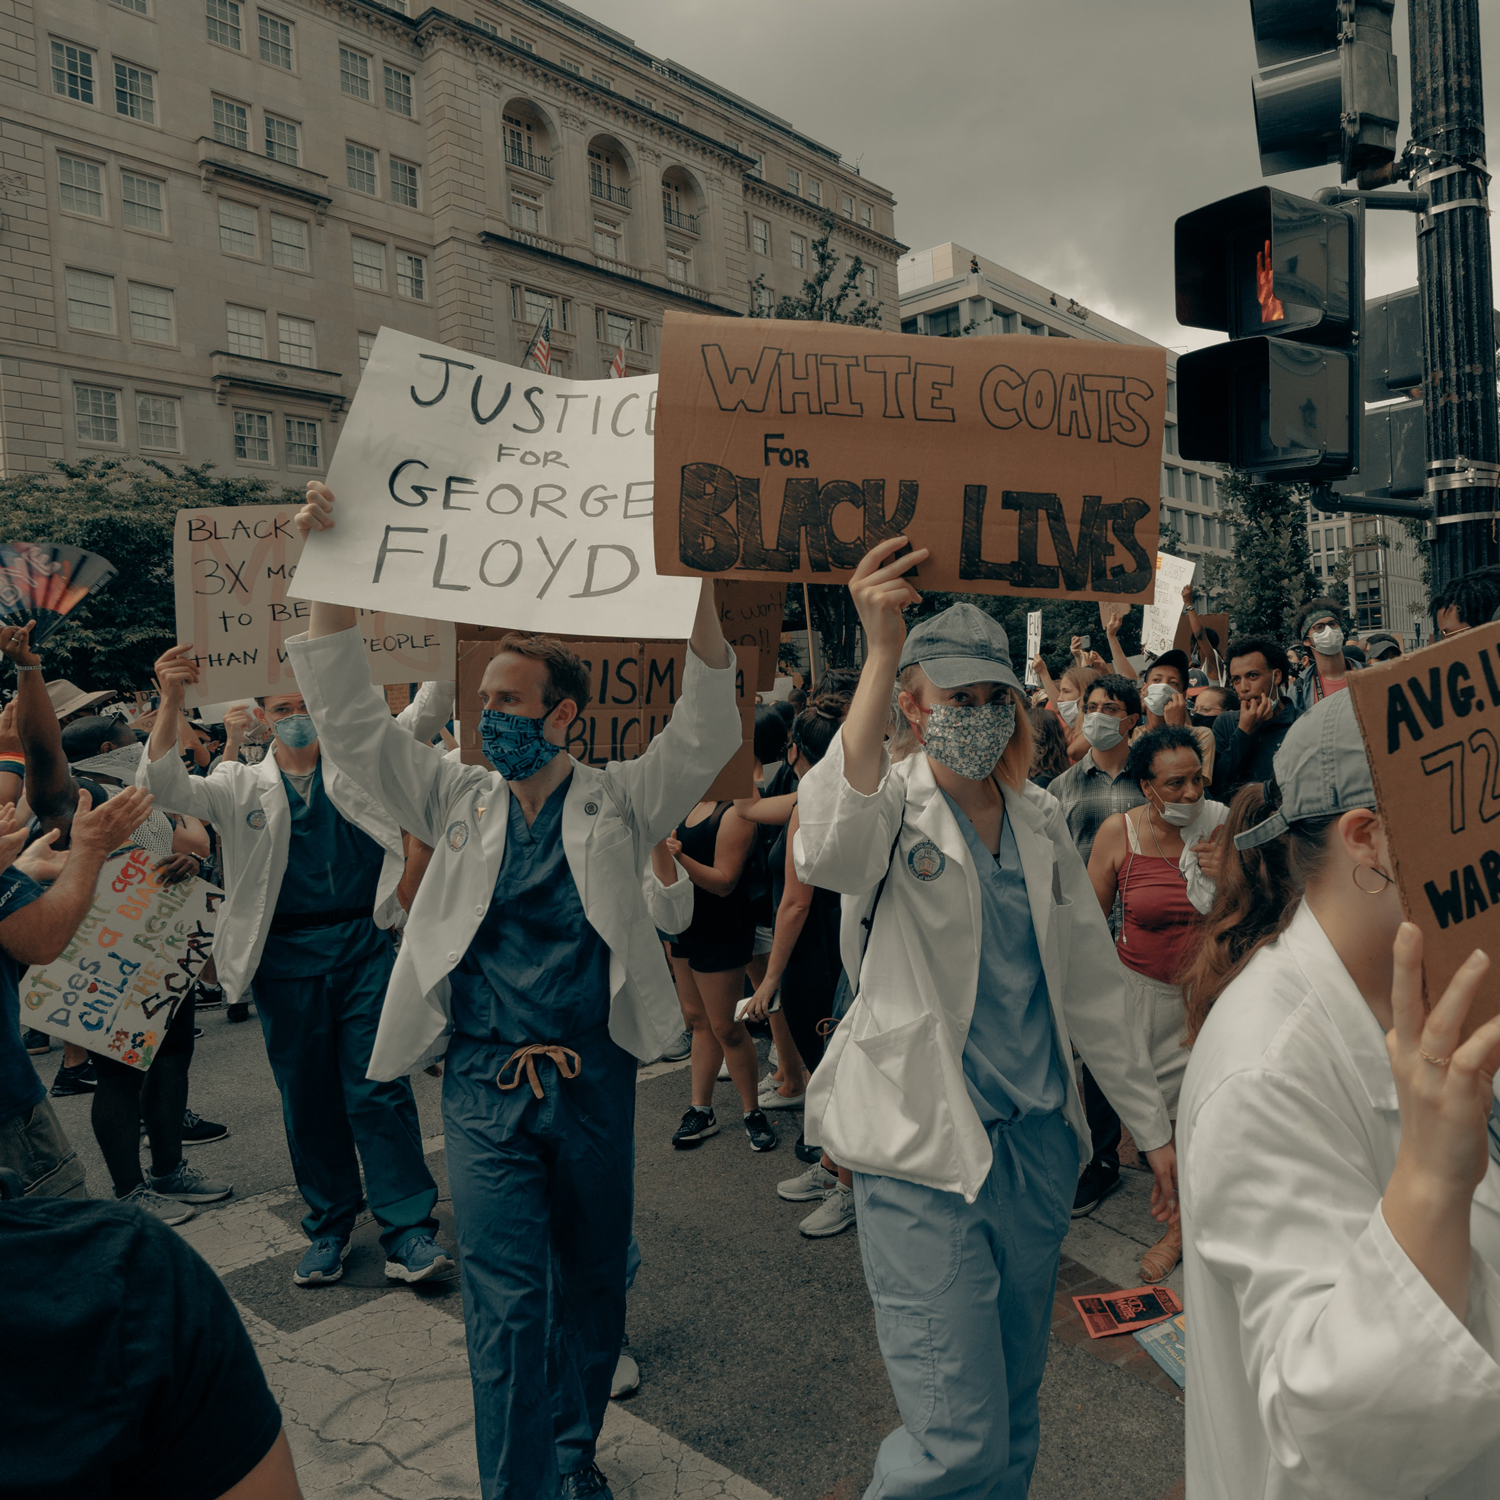
That was a very long time ago. George Floyd was alive on that day, and he continued to walk, breathe, and live among us for the next six and one-half weeks. And then, everything changed for a brief time. We all stirred to awaken—and I fear we have rolled over and fallen asleep again—back into our highly factionalized and outraged dreams. Summed up, the consequences and impact of perpetual, persistent, and unrelenting racism subjugates the COVID crisis to pale by comparison.
In this phase of my life, I believe that, as a healer, I should care about the health of individuals and society. Perhaps my span of interest should expand beyond just minding my business as an imager. Perhaps I should try to at least voice my thoughts about social inequities, and how those inequities erase multiple lifetimes of my professed service to society.
Mr. Floyd was killed, and we witnessed his death. Many of us gathered around our understanding that over 400 years of oppression, we have been either beneficiaries, perpetrators, victims, or bystanders. If victims, we are rightfully outraged. If perpetrators, I have a difficult time characterizing or understanding the defensive sentiment. If bystanders and beneficiaries, then we are faced with the leaden and heavy realization of our complicity, and our contribution to the ongoing racial crisis. Collectively, the end result has been neglect and denial of a purely man-made evil, where we have literally failed to lift a finger to solve this crisis over the centuries. With Mr. Floyd’s killing, many of us were now embarrassed into some temporary form of consciousness, and sought to right 400-plus years of a wrong. Perhaps momentarily, we recognized that the overt outrage of human ownership had been allowed to transform into the covert insidiousness of multigenerational oppression, poverty, disempowerment, and irreversible disadvantage. And now, we thought ourselves awoken, and we almost mobilized to do something real. Closer than ever before. Then again, maybe not so close. I don’t know. Memory is brief and incomplete.
Watts was big, with nearly a thousand buildings destroyed or burned over five days in 1965. Did anything substantive change after Watts? If so, why are there less black male medical students in 2020 than there were in 1973? Does that not shock us? Did Mr. Floyd also die in vain, as one of thousands? You would think that shock charges us to concrete and actionable charges to society. I don’t see the crisis seized upon, nor the corrective actions enabled. I saw large groups of committed individuals mobilized in the streets with my own eyes, propelled by the strength of their convictions and their fearlessness. And I don’t see where all that energy and passion was constructively directed.
We are physicians and health care workers, which means that we not only care for the human physic, we realize the irreducible entanglements that the body has with society, spirit, and soul. Can we be radiologists and not care about lead levels in water supplies, intentional violence, and child hunger because we are only interested in the latent image? Can we be disinterested by social inequity? Can we be untroubled by injustice, when such injustice neutralizes multiple lifetimes of our collective best radiologist efforts?
So, what are we supposed to do? Perhaps, at the least, we have to commit to not only work on equity in our immediate environment, we have to also recognize the insidious permanence of the condition. Yet there are also specific steps and actions that we can take.
What are concrete steps we can take? Where our immediate environment is concerned, we are all in need of implicit bias training and bystander training. How else can we change our immediate environment unless we understand what is hurtful, and unless we each believe our duty includes stepping in and clearly addressing inequity? There are dozens of online implicit bias training modules that can remind us that each and every one of us suffers from implicit bias, and that this awareness of our implicit bias is the first step in controlling it.
Bystander training is more complicated. It demands an understanding from each of us about when and how we would step in when we see something heinous, or even something just slightly hurtful. Alternatively, would we prefer to lower our heads and walk away to save ourselves? And then, following that, could we look at ourselves in a mirror? Learning about microaggressions and interventions is time consuming, and another ingredient that contributes to establishing a fair and equitable society.
A higher level of commitment is that of outreach and pipeline creation, where we choose to go to such groups as disadvantaged elementary and high school students and tell them about radiology—taking along team members such as technologists and nurses, so these students can envision an alternative future for themselves. Even if we only touch a small number of lives, in and of itself, that has meaning and substance, and may result in further cycles of engagement and economic salvation. It takes so little additional effort to positively affect the lives of others.
Only through vigilance and an understanding of the need for durable and enduring change can we hope for improvement. More than 400 years of inequity demand continuous and unrelenting pressure for change to occur. This is not a moment, or a project, or an initiative. It is a commitment for life to remain engaged and awoke, in order to better the condition of our brothers and sisters. For many of us, it is our understood duty.