
Linda Moy
Professor of Radiology NYU School of Medicine Center for Advanced Imaging Innovation and Research
Laura and Isaac Perlmutter Cancer Center
Published June 22, 2020
Breast cancer is the most common cancer in women worldwide with approximately 2 million cases diagnosed each year. In the United States, breast cancer is the second leading cause of cancer-related mortality among women. Multiple studies showed that regular screening mammography reduced breast cancer mortality by 40% or more. However, this year, we learned that men at high risk of developing breast cancer may benefit from mammography.
Screening of Men at High Risk for Breast Cancer
Researchers at NYU School of Medicine conducted the largest review in the United States of the medical records of men who have had a screening mammogram. The study involved 1,869 men, ages 18 to 96, who had a mammogram between 2005 and 2017. Some men sought testing because they felt a mass in their breast, while others had no symptoms and wanted to be screened because a family member had recently received a breast cancer diagnosis. In total, 41 men were found to have breast cancer, as confirmed by breast tissue biopsy. Among the 271 men who had screening exams, 5 had the disease. All those with breast cancer had surgery (mastectomy) to remove their tumor. A key finding was that mammography was more effective at detecting cancer in men with high risk than is the norm for women with average risk of breast cancer. For every 1,000 exams in these men, 18 had breast cancer. By contrast, the detection rate for women is roughly 5 for every 1,000 exams.
Among the study’s other main findings was that men who had already had breast cancer were 84 times more likely to get it again than men who had no personal history of the disease. Men with an immediate relative who had breast cancer, such as a sister or mother, were three times more likely to develop the disease. Other men with elevated risk of breast cancer included those of Ashkenazi descent, an ethnic group widely known for high rates of some cancers (who were 13 times more likely to get breast cancer than non-Ashkenazi men) and those who had genetic mutations, such as BRCA1 or BRCA2 (up to 7 times more likely than men with no genetic risk). Current National Comprehensive Cancer Network Guidelines only recommend checking for breast cancer as part of annual physical exams, not using more sensitive imaging tests like a mammogram, for men age 35 and older with BRCA mutations. The take-home point is that men need to be more aware of their risk factors for breast cancer and that they, too, can develop the disease.
Contrast Enhanced Spectral Mammography
Another exciting development is that the armamentarium that radiologists have to detect breast cancer continues to expand. The latest imaging tools focus on functional imaging tests that reveal physiological activities within the breasts. Functional imaging includes measuring changes in metabolism (e.g., PET/CT or PET/ MRI), changes in the tumor cellularity (diffusion weighted imaging on MRI), regional chemical composition (MR spectroscopy, sodium MRI) and changes in blood flow. The increase in the number of blood vessels (neoangiogenesis) and the increased permeability of blood vessels that feed a tumor are the two main factors that account for uptake of gadolinium that leads to the enhancement of breast cancers on MRI. But MRI is expensive, and we know that iodine based contrast may also be used to detect breast cancer. As a result, contrast enhanced spectral mammography (CESM) is being used in both the screening and diagnostic setting. Similar to breast MRI, CESM identifies the increased blood flow associated with breast cancer and is largely independent of breast density.
Compared with MRI, clinical implementation of CESM is much easier and at much lower costs. CESM requires an intravenous injection of iodinated contrast (dose 1.5 ml/kg) and a dual energy mammography system. A “low-energy” acquisition image resembles a normal mammogram, whereas a “high-energy” image, using a keV above the k-edge of iodine, will enhance with the contrast agent signal. Images are performed in the standard craniocaudal and mediolateral mammographic views. The postprocessing, recombined iodine-only mammograms will identify enhancing lesions. Studies show that CESM has good diagnostic accuracy when used to evaluate the extent of disease in women newly diagnosed with breast cancer. Like breast MRI, CESM outperforms combined mammography and ultrasound in the detection of additional disease and in assessment of tumor size, compared with pathology. The literature reports that CESM has a small reduction of sensitivity, while providing a higher specificity compared with breast MRI in the evaluation of tumor extent.
In addition, CESM works well as a screening exam with an additional cancer detection rate 6.6 – 13.1/1,000 over conventional mammography. Therefore, it may be feasible to screen a larger population of women (e.g., women at moderately increased risk for breast cancer), and it may be advantageous to use CESM over breast MRI in this subset of women. Overall, CESM is a safe technique with a modest increase in the radiation dose compared to conventional mammography. Also, serious adverse contrast reactions are infrequent. Currently, the lack of a CESM-compatible biopsy device for lesions exclusively seen on CESM is a limitation of this new technique.
Abbreviated Breast MRI and Ultrafast MRI
Recently, many authors have evaluated the potential of an abbreviated breast MRI to increase the accessibility of breast MRI, especially for the screening of women at above-average risk for breast cancer. The conventional breast MRI exam is a 30-minute examination that is expensive and not well tolerated by some patients. These factors, along with the limited availability of MRI scanners, preclude population-wide screening with breast MRI. Abbreviated MRI, with shorter image acquisition and interpretation times, may increase the availability of breast MRI and reduce the costs. The basic abbreviated breast MRI protocol includes a pre-contrast and one post-contrast T1-weighted imaging, along with subtraction images and maximum intensity projection images. Multiple variations on this basic protocol have been evaluated. These protocols exploit the high sensitivity of MRI, while reducing acquisition and interpretation times. A recent review of 21 studies on abbreviated breast MRI, performed in eight different countries and in over 4,500 women, confirmed the diagnostic accuracy was similar to the full breast MRI protocol.
With stronger magnets and improvements in breast coils and MRI software, ultrafast sequences have been developed to measure the rapid arterial perfusion and the rapid venous drainage of breast cancers. The temporal resolution of ultrafast protocol is typically less than 10 seconds/frame and may be incorporated into abbreviated or full breast MRI protocols. The hope is that imaging faster may allow radiologists to better distinguish between benign enhancing lesions and background parenchymal enhancement from breast cancers. Ideally, ultrafast MRI sequences may allow for increasing the specificity of abbreviated breast MRI, without increasing the scan time.
Artificial Intelligence
Without a doubt, artificial intelligence (AI) is the most talked about new diagnostic development in the field of radiology. Breast imaging is at the forefront of this research because we have decades of experience using computer-aided detection (CAD). Further, similar to chest radiography, large numbers of screening mammograms are available to be converted into datasets to train these AI algorithms. These new deep learning–based CAD models are proliferating due to recent breakthroughs in computer technology, data science, and algorithm development. Computer processing speed and memory have increased exponentially, owing to faster graphics processing units and parallel processing. Simultaneously, there have been mathematical advances that enabled the use of complex and multilayered neural networks, which led to a markedly improved performance of machine interpretation of highly standardized imaging tasks (e.g., predictions of cancer or no cancer).
New CAD platforms will differ from traditional CAD in several important ways. Some of these deep learning models no longer require manual feature design and minimize training with humans (i.e., radiologists). These AI algorithms learn discerning features that are best predictive of outcomes independently and may identify novel imaging features that are imperceptible to the human eye. The capacity for continuous feedback and learning will allow deep learning–based CAD to improve over time. In theory, deep learning algorithms can be trained for pattern recognition of image data (pixel-related information), correlate that data to tumor registry data (the truth), and assess risk when it recognizes a similar pattern (predict likelihood of cancer). Further feedback into the AI algorithm of whether that prediction is correct and truth-based will improve its performance in the future. New CAD systems may eventually be able to identify novel features associated with more relevant cancers by incorporating patient- and tumor-level variables—a task that is now performed in small groups of patients, usually in the research setting. This design has the potential to maximize the mortality benefit of breast cancer screening and to address the issues of overdiagnosis and overtreatment. Therefore, there is hope that these deep learning algorithms may hold real potential to improve clinical care.
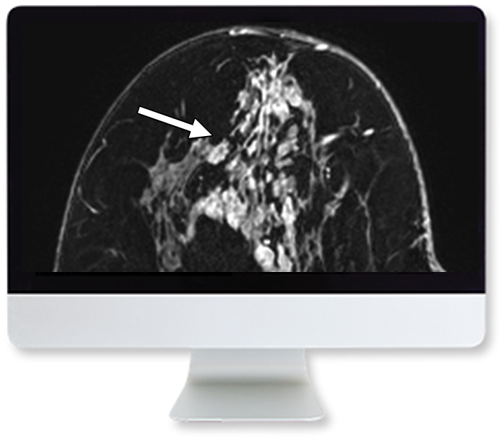
Clinical Case-Based Review of Breast Imaging
Focus on honing your breast imaging diagnostic skills. This special course combines didactic lectures and rapid fire case review sessions to provide deeper insights into breast imaging.
The literature on these AI algorithms for mammography shows that their performance for lesion detection and classification are approaching that of radiologists. A preliminary study showed a similar diagnostic accuracy for an AI algorithm that evaluated screening digital breast tomosynthesis exams. It is anticipated that these AI algorithms will play a major role in screening in the near future, both to improve the quality of the screening programs and to assist with the increasing workload of interpreting screening mammograms. Furthermore, early studies suggest that when AI models predict a very low likelihood of malignancy, these mammograms may be triaged and interpreted by the algorithm alone, saving time and resources.
Other potential applications for screening mammography deep learning models beyond lesion detection and classification include assessment of mammographic breast density. This quantitative analysis of breast density is important because supplemental screening is recommended in women with mammographically dense breasts. A more recent development is utilizing these AI algorithms to predict a woman’s risk for developing breast cancer in the future by incorporating the normal mammographic parenchymal pattern (density, texture, etc.). Risk assessment may be further personalized when information from the electronic health record is included in deep learning risk models. The addition of radiogenomics, which combines radiologic phenotypes with underlying genetic signatures, has the potential to add relevant tumor and patient predictive and prognostic information using information extracted from images.
Although there is a lot of excitement about AI, many experts urge caution because these AI tools haven’t been evaluated in a wide variety of clinical settings. Most studies on AI and breast imaging are retrospective enriched reader studies. To increase the generalizability of the results, prospective studies in different patient populations should be performed.
It is clear that the “one size fits all” approach may no longer be relevant. Instead, the standard mammograms, ultrasounds, and breast MRI exams are being tailored for specific clinical indications, often augmented with AI tools.