Tag: InPractice Articles

  • Finding the Leak: Tips for CSF Leak and Venous Fistula Localization

    Finding the Leak: Tips for CSF Leak and Venous Fistula Localization

    Published March 8, 2023
    avatar

    Andrew L. Callen

    @AndrewCallenMD
    Department of Radiology, Neuroradiology Section, University of Colorado Anschutz Medical Campus

    Spontaneous intracranial hypotension (SIH) is a disabling headache disorder caused by abnormal leakage of CSF through a dural defect, ruptured meningeal diverticulum, or CSF venous fistula (CVF) [1]. The clinical hallmark of this syndrome is a headache that improves when supine and worsens when upright. Although iatrogenic post–dural puncture headaches have been recognized for over a century, the understanding of spontaneous leakage of CSF and its associated syndrome has evolved rapidly over the past decade [2]. CVF in particular was first recognized in 2014, so our understanding of how to localize and treat this specific pathology is in its relative infancy [3].

    As radiologists, we find ourselves uniquely positioned to both di­agnose and treat patients with spontaneous intracranial hypotension (SIH). Understanding the spectrum of SIH imaging abnormalities in the brain and spine, how to implement specialized MRI and myelo­graphic protocols to localize CSF leaks and CVF, and the treatment options available allows optimal care of these patients [4].

    First-Line Evaluation With Noninvasive Imaging

    MRI of the Brain

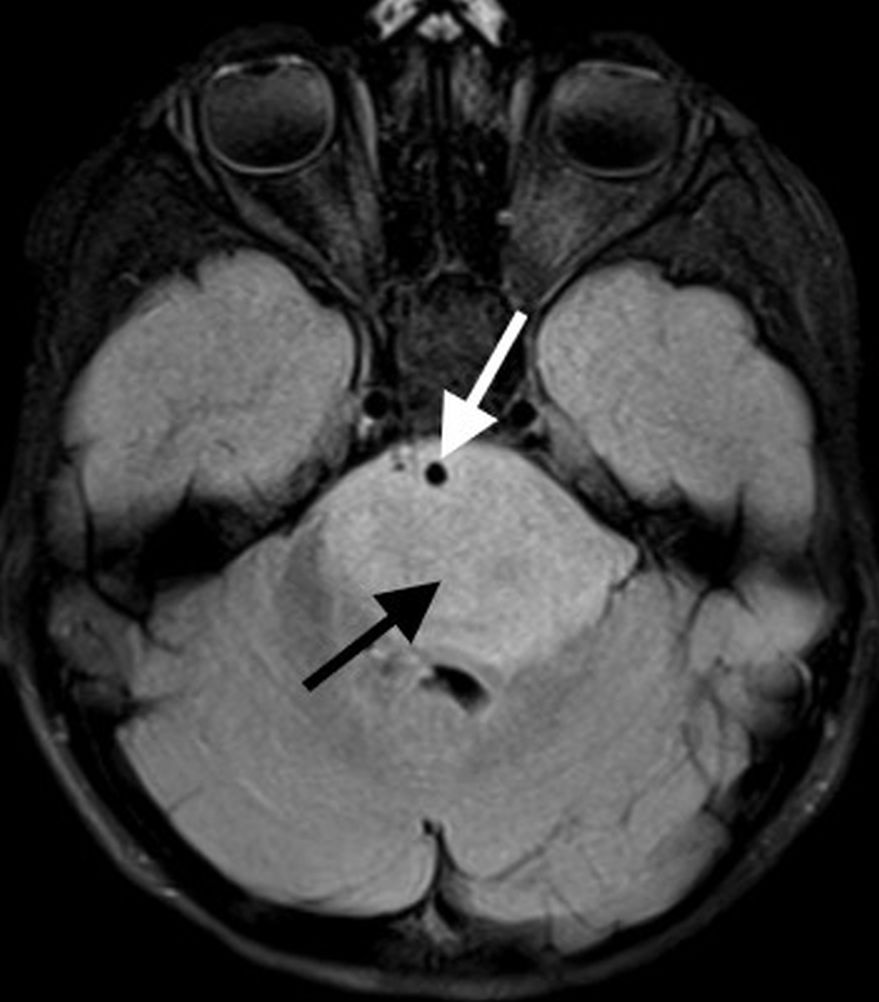
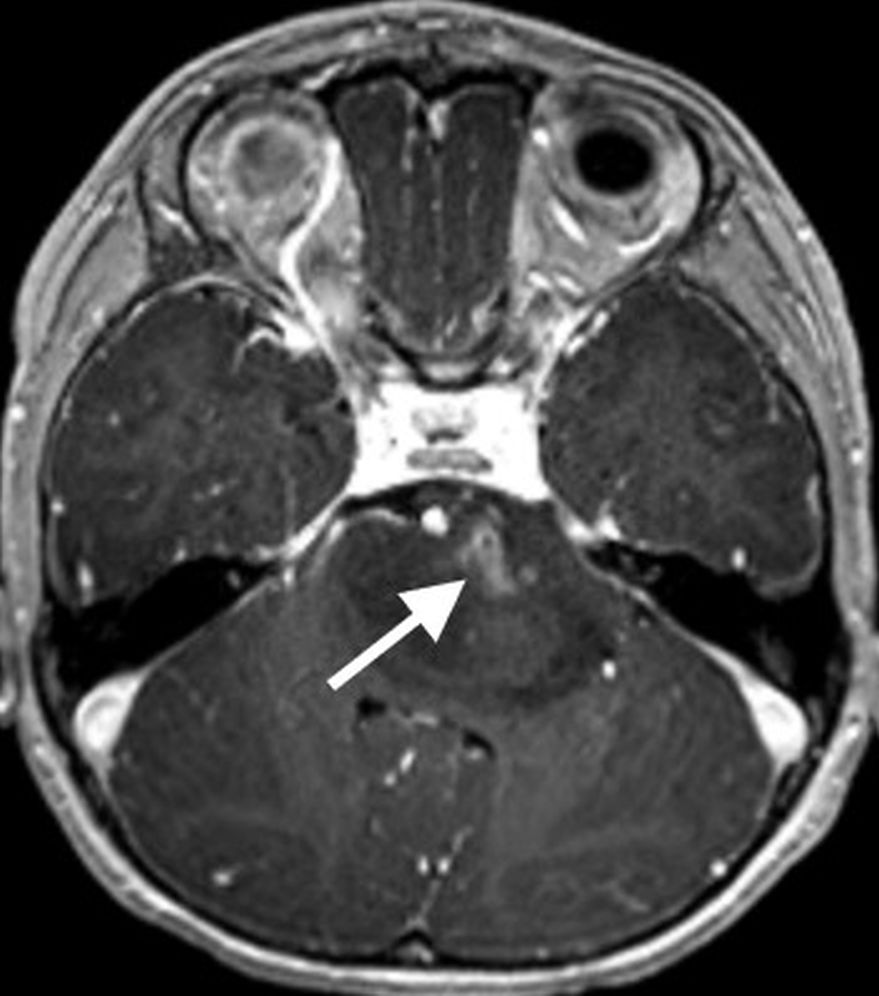
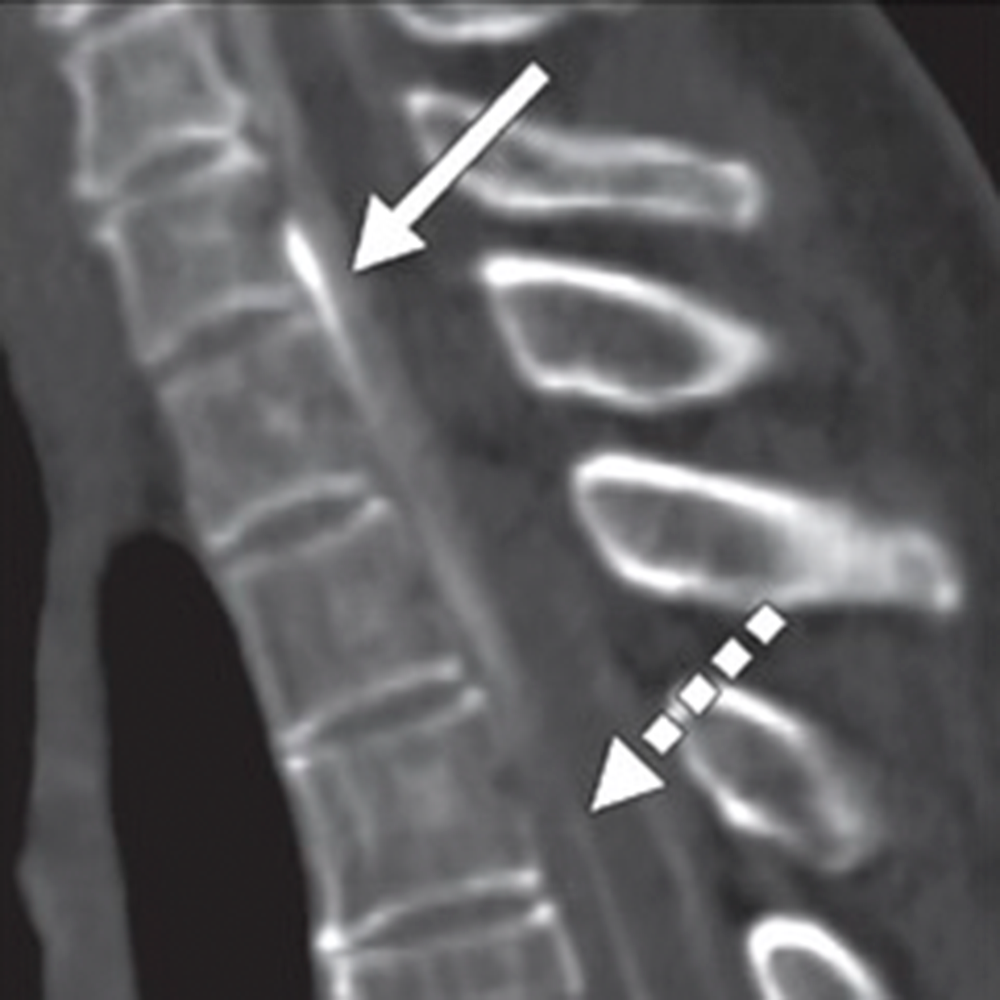
    Routine MRI brain protocols consisting of contrast-enhanced 3D T1-weighted, susceptibility-weighted, and T2-weighted FLAIR sequences are sufficient to evaluate evidence of underlying SIH. Changes during SIH can be framed in terms of the Monro-Kellie doc­trine: in normal states, the volumes of blood, CSF, and brain paren­chyma are in equilibrium [5]. In response to abnormal CSF deliquora­tion, compensatory enlargement or deformation of brain parenchyma and vascular structures occurs, resulting in sagging of the brainstem, diffuse circumferential pachymeningeal thickening, epidural venous engorgement, and pituitary hyperemia [6]. Subdural hygromas or he­matomas may occur secondary to distention of intracranial venous structures, which must not be mistaken for posttraumatic hemor­rhage, as surgical evacuation of the collections will not improve the patient’s underlying pathology [6]. Hemosiderosis, particularly of the infratentorial brain, can be seen and may be due to repeated micro­trauma to the epidural venous plexus at the dural defect, resulting in circulation of subarachnoid blood products [7] (Fig. 1).
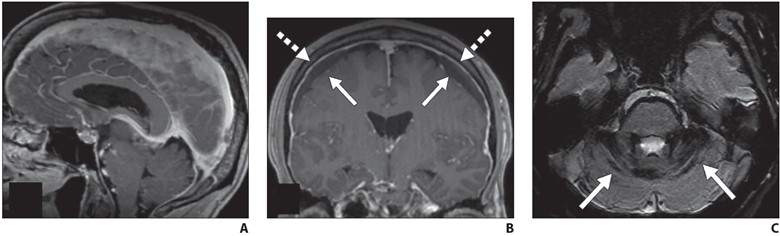
    Fig. 1—MRI findings of spontaneous intracranial hypotension.
    A, Sagittal contrast-enhanced T1-weighted image shows sagging of brainstem with effacement of mamillopontine, prepontine, and suprasellar intervals as well as engorgement of dural venous sinuses.
    B, Coronal contrast-enhanced T1-weighted image shows bilateral subdural hygromas (solid arrows) and diffuse smooth pachymeningeal thickening and enhancement (dashed arrows).
    C, Axial susceptibility-weighted image shows diffuse infratentorial hemosiderosis (arrows).

    Emerging evidence suggests that although findings of SIH are specific for an underlying CSF leak, brain MRI may have limited sensitivity for these findings, particularly in chronic leaks [8]. A recent meta-analysis suggests that at least 19% of patients with proven CSF leaks may have normal findings on brain MRI [9]. Ad­ditional studies have reported that as a CSF leak persists, imaging findings either resolve or become more subtle, particularly diffuse pachymeningeal enhancement [10].

    The following Bern criteria [11] have been developed as a scoring system using both qualitative and quanti­tative information on brain MRI to assign high, intermediate, or low probability of SIH:

    Bern Criteria for Assessment of Spinal CSF Leak Based on Brain MRI Findings

    MRI FindingNo. of Points
    Pachymeningeal enhancement2
    Venous engorgement2
    Suprasellar effacement (≤ 4 mm)2
    Subdural collection1
    Prepontine effacement (≤ 5 mm)1
    Mamillopontine effacement (≤ 6.5 mm)1
    Note—Based on information in Dobrocky et al. [11]. When points for individual findings are totaled, 0–2 points indicates low probability of spontaneous intracranial hypotension, 3–4 points indicates moderate probability, and 5 or more points indicates high probability.

    Standardized reporting for brain MRI with clinical indications suggestive of underlying SIH can appropriately frame the risks and benefits of further invasive diagnostic testing and avoid wrongly characterizing a patient as not having SIH because of a negative brain MRI examination. The radiologist’s understanding of limited sensitivity of brain MRI is critical for patients with SIH; it is strongly encouraged to adopt language that conveys probabilities of underlying SIH and incor­poration of Bern scoring to not prevent further diagnostic workup in cases of high clinical suspicion.

    MRI of the Spine

    If SIH is suspected on the basis of clinical or imaging findings, imaging evaluation of the spine must be performed, as most CSF leaks resulting in SIH occur in the spine, not from the skull base [12]. In the upright position, intracranial pressure is slightly nega­tive relative to atmospheric pressure, and pressure in the spinal compartment is slightly positive, which can result in spontaneous leakage of CSF in sufficient quantities to result in SIH [13]. This phenomenon is critical for the radiologist to understand, as it is not rare for patients to be inappropriately referred for CT cisternog­raphy in the context of orthostatic headaches, positive brain MRI, and rhinorrhea for suspicion of an underlying skull base leak.

    Although routine spine imaging protocols can adequately delin­eate a dorsal or ventral spinal epidural CSF collection, leaks origi­nating from the lateral dura (ruptured nerve root axilla or meningeal diverticulum) will not be evident on routine axial non–fat-saturated T2-weighted MRI. Similarly, laterally directed meningeal divertic­ula will not be completely characterized on routine protocols (Fig. 2).
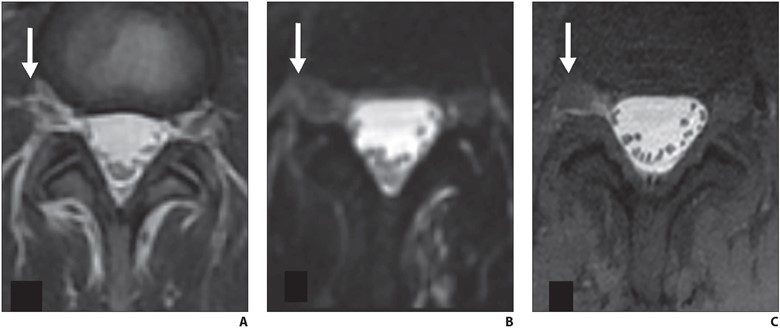
    Fig. 2—Axial lumbar spine MRI findings of 39-year-old woman with orthostatic headache. (B and C adapted from [4])
    A and B, Axial T2-weighted (A) and heavily T2-weighted fat-saturated (B) images do not delineate any clear extradural fluid. T2-weighted hyperintensity lateral to dura (arrow, A) blends with fat and epidural veins (A). Three-dimensional CSF leak protocol shows minimal T2-weighted asymmetry (arrow, B) in right L4–5 neural foramen at same level (B).
    C, Delayed T1-weighted fat-saturated image with intrathecal gadolinium confirms extradural CSF (arrow) at this level. Patient was treated with transforaminal epidural fibrin patch that relieved symptoms.

    Therefore, specialized 3D heavily T2-weighted fat-saturated spine MRI protocols should be used routinely in the workup of po­tential underlying SIH. At my institution, we use a Siemens Health­care protocol with coronal fat-saturated HASTE images with 256 echo train length, 0.9-mm3 isotropic resolution, and TR/TE of 8000/271. These images are reformatted in sagittal and axial planes, reformatted into a coronal volumetric maximum intensity projection, and supplemented with sagittal STIR sequences at each spinal level. The entire protocol encompassing the cervical, thoracic, and lumbar spine is performed in approximately 40 minutes.

    If a fluid collection is identified, dy­namic myelography using digital subtrac­tion or CT techniques can precisely locate the leak, allowing percutaneous or surgical treatment. If no extradural fluid collection is present, dynamic myelography can be used to localize CVF. Supplementary MR myelography with intrathecal gadolinium can also be used to localize slowly leaking dural defects and meningeal diverticula.

    A large epidural fluid collection with a substantial ventral component almost al­ways suggests an underlying ventral dural defect, often caused by a bony osteophyte. In contrast, epidural fluid collections that have a minimal ventral component but a greater posterolateral component are often caused by ruptured nerve root sleeves or meningeal diverticula [14] (Fig. 3).
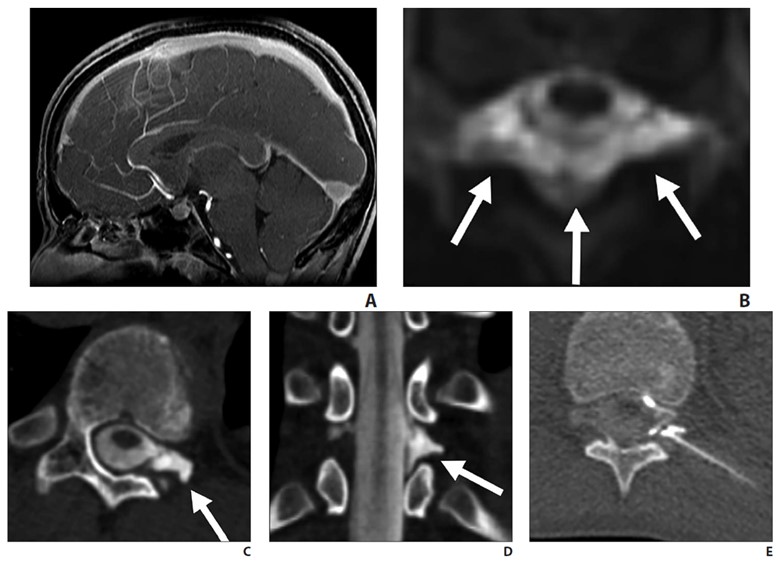
    Fig. 3—14-year-old boy with sudden-onset orthostatic headache after playing golf.
    A, Sagittal contrast-enhanced T1-weighted MR image shows sagging of brainstem, dural venous sinus, and pituitary engorgement.
    B, Axial reconstruction of 3D T2-weighted fat-saturated MR image of spine shows epidural fluid collection confined to dorsal and lateral epidural spaces at T10 level (arrows) without ventral component.
    C and D, Axial (C) and coronal (D) slices through left lateral decubitus dynamic CT myelography show pooling of contrast material along lateral epidural space at T10–11 (arrows), arising from ruptured T10 nerve root sleeve.
    E, Intraprocedural CT image obtained during CT-guided epidural fibrin glue patching shows percutaneous epidural injection of fibrin and autologous blood. Treatment provided only temporary relief, so patient underwent primary surgical repair.

    This distinction is important, because it will dictate patient positioning during dynamic myelography. Thus, the presence and loca­tion of epidural fluid collection should be described in the radiology report.

    In the absence of epidural fluid collec­tion, the radiologist should report the pres­ence, overall burden, location, and lateral­ity of meningeal diverticula in the spine, because meningeal diverticula are often the nidus of CVF. An asymmetric burden of meningeal diverticula may inform ini­tial patient positioning in dynamic my­elography. Additional supplementary find­ings include any large osteophytes (even in the absence of epidural fluid collection) or enlargement of the thecal sac, which may reflect underlying dural ectasia.

    Dynamic Myelography

    What distinguishes dynamic from con­ventional myelography is the timing of imaging and the use of provocative ma­neuvers such as patient elevation, pressure augmentation, and inspiration to increase conspicuity of CVF [15, 16]. Conventional myelography is often performed in two parts, with the injection of intrathecal io­dinated contrast material (often performed under fluoroscopy) followed by whole spine CT after a delay to allow diffusion of contrast material throughout the thecal sac and delineation of the entire subarach­noid compartment. In contrast, dynamic myelography is performed to identify fast, transient egress of CSF into a paraspinal vein laterally. Immediate imaging is ob­tained after injection of contrast material with the patient in the lateral decubitus po­sition so that contrast material layers along the meningeal diverticula where most CVF tend to arise. Dynamic myelography can be performed with either CT (CTM) or digital subtraction (DSM) techniques. DSM has high temporal resolution but suffers from lack of simultaneous whole spine imaging and is susceptible to motion, superimposi­tion, and breathing artifacts, often requir­ing general endotracheal anesthesia for technical success. In contrast, dynamic CTM does not require general anesthesia, acquires simultaneous whole spine imag­ing, and has high spatial localization, al­lowing optimal treatment planning. DSM may not be available at many institutions; therefore, this chapter discusses dynamic CTM technique in detail. Procedural de­tails of DSM have been published [17].

    When an extradural collection is pres­ent, the patient will be either prone in case of a suspected dural defect or decubitus when a fast leak from a ruptured meningeal diverticulum or ruptured nerve root axilla is suspected. When CVF is suspected, the patient is placed in the decubitus position.

    After intrathecal access is achieved with a spinal needle and iodinated contrast mate­rial is injected into the subarachnoid space (5–10 mL of 300 osmolar iodinated contrast material), the patient’s hips are elevated with a foam wedge or inflatable air trans­fer mattress. When a foam wedge is used, the patient is positioned on the device from the outset, and whole spine CT is performed immediately after injection of contrast ma­terial, but because the patient is not in a hor­izontal position, opening pressure cannot be measured, and thus pressure cannot be reli­ably manipulated with intrathecal saline in­fusion. When an inflatable mattress is used, after accessing the subarachnoid space, opening pressure can be measured with a digital manometer and, as long as pressure is normal or low, subsequently augmented with 5-mL aliquots of sterile saline, with re­peat measurements after saline infusion to a maximum of approximately 30 cm of water. Subsequently, contrast material is injected, the needle is removed, the device is inflated for approximately 10 seconds, deflated, and then whole spine CT is initiated. In addition, studies have shown that patient inspiration during imaging can increase conspicuity of CVF, presumably lowering central venous pressure and facilitating CSF moving across the fistula [15]. Rehearsing timing of inspi­ration with the patient before the procedure can be useful to avoid technical failure.

    Once whole spine CT is initiated, at least two whole spine acquisitions phases should be performed in succession to max­imize temporal resolution. Multiphase ac­quisition allows scrutinization of paraspi­nal densities over time, as CVF often fills transiently on a single phase of acquisition (Fig. 4).
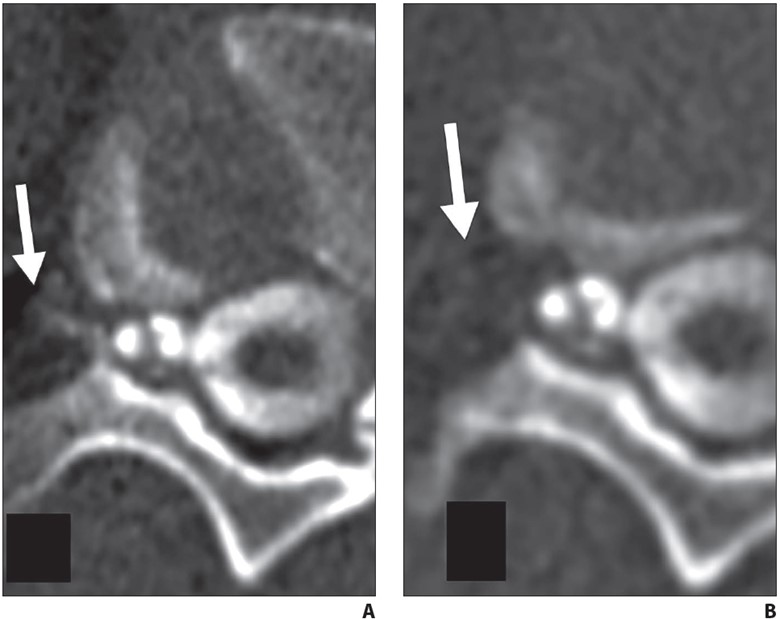
    Fig. 4—62-year-old woman with orthostatic headache.
    A, Axial early phase image of right lateral decubitus pressure-augmented dynamic CT myelogram shows filling of small paraspinal vein (arrow) lateral to perineural cyst at T11–12 level.
    B, Delayed-phase MR image shows contrast material dissipated from vein (arrow), consistent with CSF venous fistula.

    Side-by-side comparison of dy­namic CT images with preprocedural 3D heavily T2-weighted fat-saturated spine MRI helps distinguish partial filling of perineural cysts from CVF (Fig. 5).
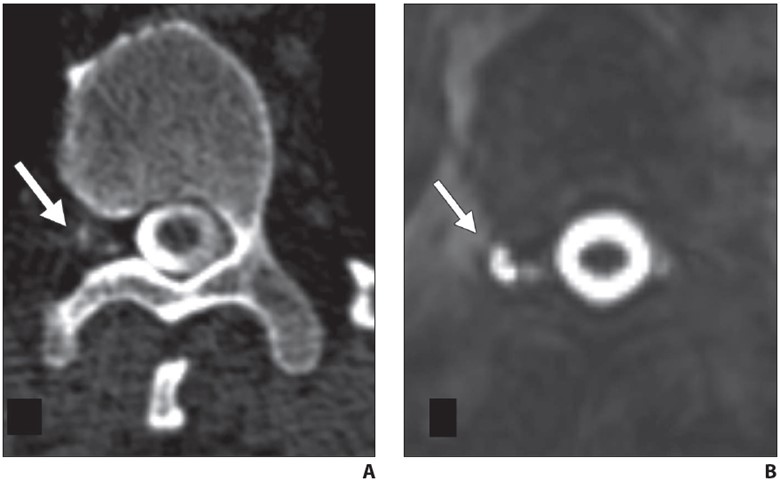
    Fig. 5—42-year-old man with orthostatic headaches.
    A, Axial decubitus dynamic CT myelogram shows irregular contrast enhancement in right T12-L1 neural foramen (arrow).
    B, Axial heavily T2-weighted fat-saturated 3D MR image with CSF leak protocol at same level delineates irregular perineural cyst (arrow), confirming contrast pattern seen in A reflects partial filling of distal portion of perineural cyst rather than CSF venous fistula.

    After multiphase whole spine CT is performed in the lateral decubitus position, the patient may be placed in the contralateral decu­bitus position for one final image, which may reveal a contralateral fistula. Because sensitivity for detecting CVF is highest on the first injection and early phase of imag­ing, dynamic myelography is traditionally performed in two sessions, one for each laterality. However, some centers have had success leaving the needle in place during patient repositioning, allowing a second injection to complete the contra­lateral image [18]. Potential concerns with this procedure are excessive needle motion and exacerbation of an iatrogenic dural puncture–related leak. When we perform same-day bilateral decubitus myelography, the needle is either retracted into the liga­mentum flavum before repositioning or the needle is removed and a second puncture is performed after repositioning. In patients with underlying connective tissue disease or who may be susceptible to post–dural puncture headache, prophylactic same-day epidural blood or fibrin glue patching at the site of puncture can be performed.

    In contrast to CVF localization, pres­sure augmentation and inspiration ma­neuvers are not necessary when locating fast leaks from a violation of the ventral or lateral dura. After injection of contrast material into the subarachnoid space, the patient’s hips are elevated and rapid whole spine imaging is performed. Images should be scrutinized for where contrast material first moves from the subarachnoid to the epidural space, filling the epidural fluid collection or lateral epidural space (Fig. 6).
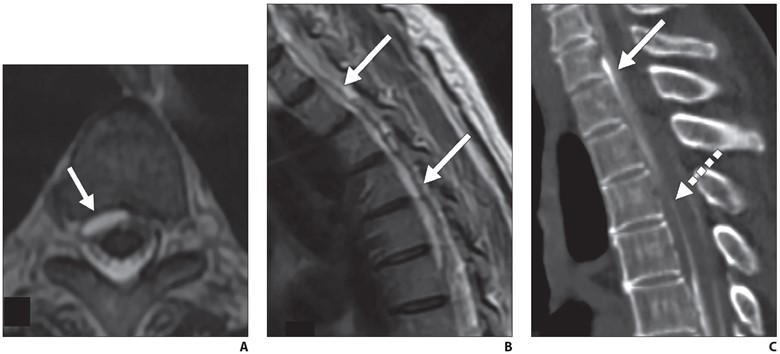
    Fig. 6—72-year-old woman with orthostatic headaches.
    A and B, Axial (A) and sagittal (B) T2-weighted MR images through thoracic spine show ventral epidural fluid collection extends from T1 to T6 (arrows).
    C, Sagittal prone early-phase dynamic myelogram shows filling of ventral epidural fluid collection at C7-T1 level with dense contrast material (solid arrow), while more inferior component of collection (dashed arrow) has not yet filled, suggesting that dural defect is at C7-T1 level.

    Regardless of technique, all spinal access should be attempted with a noncutting, pencil point sidehole spinal needle, rather than a traditional cutting spinal needle, which has been shown to minimize the risk of post–dural puncture headache [19].

    In cases of high pretest probability (i.e., positive brain MRI and/or highly suspi­cious clinical symptoms), dynamic my­elography may be repeated several times to discover the underlying CVF. Repeated procedures must be weighed against the risk of radiation and multiple dural punc­tures for a given patient. In patients under­going repeat dynamic myelography, we may consider concurrent infusion of 0.2 mL intrathecal gadolinium (gadobenate dimeglumine 0.5 M; MultiHance, Bracco) to perform delayed, pressure-augmented MR myelography to potentially reveal a slowly leaking dural defect or meningeal diverticulum. We perform MR myelogra­phy using a multiplanar T1-weighted fat-saturated sequence and modified 3-point Dixon fat-suppression technique with 3-mm section thickness with 0.5-mm skip (TR/TE, 475/10; echo train length, 3–4; bandwidth, 50 Hz; matrix size, 320 in frequency-encoding direction and 224 in phase direction). After sagittal full spine acquisition, real-time monitoring is per­formed to prescribe additional axial and coronal planes of interest to minimize scan time while optimizing image quality.

    Treatment Options

    CSF Venous Fistula

    Percutaneous fibrin glue embolization of CVF is a reasonable first treatment option after a CVF is identified, because it is mini­mally invasive and can be performed on the same day as dynamic myelography [20]. The technical details of the procedure have been described, but briefly, a 20- or 22-gauge spinal needle is advanced to the origin of the CVF under intermittent CT guidance. When the needle is in the desired position, a test injection of air or dilute contrast material is performed to confirm epidural positioning of the needle. In addition, injection of fibrin glue into the adjacent meningeal diverticu­lum has been reported to result in technical success without reported chemical menin­gitis or arachnoiditis [21]; 2–4 mL of fibrin injectate is instilled through the needle, then an image is obtained to observe the injectate spread pattern.

    We routinely perform anticipatory fi­ducial marker placement during fibrin glue injection to facilitate easy relocal­ization in case of a repeat procedure or subsequent surgery or endovascular treat­ment. If the first fibrin glue embolization is unsuccessful, a second attempt may be made prior to surgical or endovascular referral. Patients receiving a repeat fibrin injection should be premedicated with 50- mg oral diphenhydramine 30 minutes be­fore the procedure to minimize potential for an allergic reaction. Fibrin glue is a biosynthetic material made from reconsti­tuted human blood components and con­tains aprotinin, which has been associated with allergic reactions.

    At my institution, patients who do not respond to percutaneous fibrin glue em­bolization are referred for either endovas­cular embolization or surgical ligation, depending on the patient’s preference and risk tolerance. Surgical ligation of CVF is considered definitive and has been per­formed the longest of the treatment modal­ities; however, it is the most invasive treat­ment option and many patients prefer to avoid surgery if possible. When undergo­ing endovascular embolization, access to the culprit paraspinal vein is achieved via the azygos or hemiazygos via the internal jugular or femoral vein. After the correct paraspinal vein is catheterized, emboliza­tion may be performed with either a liquid embolic system (Onyx, Medtronic) or N-butyl-cyanoacrylate.

    Dural Defects and Meningeal Diverticula

    First-line treatment of dural defects and leaking meningeal diverticula is targeted epidural blood and/or fibrin glue patch­ing. The epidural space can be accessed via dorsal interlaminar or transforaminal approaches depending on the type of leak. In dorsal interlaminar approaches, a loss of resistance technique using air can be performed to ideally position the needle in the epidural compartment, whereas in transforaminal approaches, epidural po­sition can be confirmed with injection of a small amount (approximately 0.5 mL) of dilute iodinated contrast material to observe epidural spread of injectate. As many dural defects are ventral, far lateral transforaminal approaches can be used to attempt to access the ventral epidural space (Fig. 7).
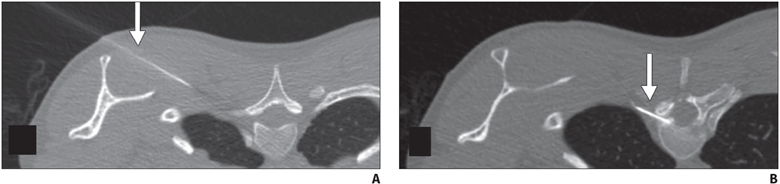
    Fig. 7—45-year-old man with orthostatic headaches and confirmed ventral dural defect at T1-2 level.
    A and B, Sequential axial CT slices obtained during epidural blood patching show far lateral transmuscular approach using 15-cm spinal needle (arrow) to reach ventral epidural space at T1-2 level.

    After treatment, patients should be monitored for resolution of symptoms and repeat imaging performed to ensure reso­lution of brain findings and epidural fluid collection. Persistent evidence of an epi­dural fluid collection even in the context of symptom resolution may require surgical treatment, because a chronic dural defect increases the risk of hemosiderosis, which causes its own clinical syndrome and is largely irreversible.

    Patients Without a Localized Leak or Fistula

    Patients with suspected SIH in whom no leak or fistula is identified on dynamic myelography present a management chal­lenge, particularly if their first-line brain and spine MRI did not show findings of SIH. In these patients, empirical multilev­el epidural blood patching is offered for both potential therapeutic and diagnostic purposes. Patients with a strong but tem­porary clinical response to patching may warrant repeat dynamic myelography. In patients without a clinical response to empirical patching, alternative diagnoses may be considered. My institution has es­tablished a multidisciplinary conference consisting of neuroradiologists, neurolo­gists, and neurosurgeons to discuss man­agement of these and other patients to co­ordinate and optimize care.

    SIH is an increasingly recognized, de­bilitating clinical syndrome for which ra­diologists have an opportunity to play a key role in diagnosis and treatment. By implementing specialized first-line MRI protocols and dynamic myelography tech­niques, radiologists can optimize clinical outcomes in this patient population.

    References

    1. Kranz PG, Luetmer PH, Diehn FE, Amrhein TJ, Tan­pitukpongse TP, Gray L. Myelographic techniques for the detection of spinal CSF leaks in spontane­ous intracranial hypotension. AJR 2016; 206:8–19
    2. Mokri B. Spontaneous low pressure, low CSF vol­ume headaches: spontaneous CSF leaks. Headache 2013; 53:1034–1053
    3. Schievink WI, Moser FG, Maya MM. CSF-venous fistula in spontaneous intracranial hypotension. Neurology 2014; 83:472–473
    4. Callen AL, Timpone VM, Schwertner A, et al. Algo­rithmic multimodality approach to diagnosis and treatment of spinal CSF leak and venous fistula in patients with spontaneous intracranial hypoten­sion. AJR 2022; 219:292–301
    5. Mokri B. The Monro-Kellie hypothesis: applica­tions in CSF volume depletion. Neurology 2001; 56:1746–1748
    6. Schievink WI, Maya MM, Louy C, Moser FG, Tourje J. Diagnostic criteria for spontaneous spinal CSF leaks and intracranial hypotension. AJNR 2008; 29:853–856
    7. Payer M, Sottas C, Bonvin C. Superficial siderosis of the central nervous system: secondary progres­sion despite successful surgical treatment, mimick­ing amyotrophic lateral sclerosis—case report and review. Acta Neurochir (Wien) 2010; 152:1411–1416
    8. Kranz PG, Gray L, Amrhein TJ. Spontaneous intra­cranial hypotension: 10 myths and misperceptions. Headache 2018; 58:948–959
    9. D’Antona L, Jaime Merchan MA, Vassiliou A, et al. Clinical presentation, investigation findings, and treatment outcomes of spontaneous intracranial hypotension syndrome: a systematic review and meta-analysis. JAMA Neurol 2021; 78:329–337
    10. Kranz PG, Amrhein TJ, Choudhury KR, Tanpituk­pongse TP, Gray L. Time-dependent changes in dural enhancement associated with spontaneous intracranial hypotension. AJR 2016; 207:1283–1287
    11. Dobrocky T, Grunder L, Breiding PS, et al. Assess­ing spinal cerebrospinal fluid leaks in spontaneous intracranial hypotension with a scoring system based on brain magnetic resonance imaging find­ings. JAMA Neurol 2019; 75:580–587
    12. Schievink WI, Schwartz MS, Maya MM, Moser FG, Rozen TD. Lack of causal association between spontaneous intracranial hypotension and cra­nial cerebrospinal fluid leaks. J Neurosurg 2012; 116:749–754
    13. Magnaes B. Body position and cerebrospinal fluid pressure. Part 2. Clinical studies on orthostatic pressure and the hydrostatic indifferent point. J Neurosurg 1976; 44:698–705
    14. Madhavan AA, Verdoorn JT, Shlapak DP, et al. Lat­eral decubitus dynamic CT myelography for fast cerebrospinal fluid leak localization. Neuroradiol­ogy 2022; 64:1897–1903
    15. Amrhein TJ, Gray L, Malinzak MD, Kranz PG. Respi­ratory phase affects the conspicuity of CSF–venous fistulas in spontaneous intracranial hypotension. AJNR 2020; 41:1754–1756
    16. Caton MT, Laguna B, Soderlund KA, Dillon WP, Shah VN. Spinal compliance curves: preliminary experi­ence with a new tool for evaluating suspected CSF venous fistulas on CT myelography in patients with spontaneous intracranial hypotension. AJNR 2021; 42:986–996
    17. Schievink WI, Moser FG, Maya MM, Prasad RS. Digi­tal subtraction myelography for the identification of spontaneous spinal CSF-venous fistulas. J Neu­rosurg Spine 2016; 24:960–964
    18. Carlton Jones L, Goadsby PJ. Same-day bilateral decubitus CT myelography for detecting CSF-ve­nous fistulas in spontaneous intracranial hypoten­sion. AJNR 2022; 43:645–648
    19. Philip JT, Flores MA, Beegle RD, Dodson SC, Mes­sina SA, Murray JV. Rates of epidural blood patch following lumbar puncture comparing atraumatic versus bevel-tip needles stratified for body mass index. AJNR 2022; 43:315–318
    20. Mamlouk MD, Shen PY, Sedrak MF, Dillon WP. CT-guided fibrin glue occlusion of cerebrospinal fluid-venous fistulas. Radiology 2021; 299:409–418
    21. Mamlouk MD, Shen PY, Dahlin BC. Headache re­sponse after CT-guided fibrin glue occlusion of CSF-venous fistulas. Headache 2022; 62:1007–1018
  • Pitfalls and Challenging Cases in Dementia Imaging

    Pitfalls and Challenging Cases in Dementia Imaging

    Published March 7, 2023

    avatar

    Mohit Agarwal, MD

    Department of Radiology, Division of Neuroradiology, Froedtert and Medical College of Wisconsin

    avatar

    Karen L. Salzman, MD

    Department of Radiology and Imaging Sciences, Neuroradiology Section, University of Utah

    avatar

    William T. O’Brien, Sr., DO

    Division of Neuroradiology, Orlando Health – Arnold Palmer Children’s Hospital

    avatar

    Lily L. Wang, MD

    Department of Radiology, University of Cincinnati College of Medicine

    Deposition of protein aggregates and neuronal loss are the likely cause of cognitive decline in neurodegenerative disorders. Protein aggregates such as amyloid and tau can be imaged by amyloid and tau PET, whereas neuronal loss can be revealed by MRI and FDG PET. The pattern of protein deposition and neuro­nal loss may be useful in identifying the type of dementia. Cere­brovascular disease and cerebral amyloid angiopathy can cause cognitive decline on their own, or they can worsen cognitive decline caused by other neurodegenerative disorders. Normal-pressure hydrocephalus (NPH), cerebral autosomal dominant arteriopathy with subcortical infarcts and leukoencephalopa­thy (CADASIL) syndrome, Creutzfeldt-Jakob disease, and other conditions are additional important identifiable causes of cogni­tive decline on imaging.

    Assessment of the mental function of an individual is done by evaluating the cognitive domains, including memory, attention, executive function, visuospatial function, language, and behavior [1]. Neurodegenerative disorders impair different aspects of these brain functions by affecting neuronal function, connectivity, and loss. Most of these diseases are characterized by accumulation of abnormal protein aggregates, which is theorized to result from dysfunction of the glymphatic system [1–3], abnormal protein processing, microglia-mediated inflammation, and dysregulated autophagy [4]. The neuronal dysfunction and subsequent neuronal loss caused by the accumulation of these protein aggregates can be identified by visual inspection or by quantification of cortical volumes or thickness, or they can be imaged by nuclear medicine techniques, such as FDG PET. The presence of certain abnormal protein deposits, such as amyloid and tau, can also be detected using PET ligands. Advanced MRI perfusion techniques such as arterial spin-labeling (ASL) can serve as a surrogate marker where hypoperfusion is indicative of underlying hypometabolism [5]. Early neuronal loss causes microstructural abnormalities in the white matter of the affected brain regions, which can be detected by quantitative diffusion MRI diffusion-tensor imaging metrics [6].

    In this brief review, we will discuss the most common conditions that cause cognitive impairment and dementia.

    Alzheimer Disease

    Alzheimer disease (AD) is the most common form of dementia, accounting for up to 80% of the cases [1, 7, 8]. Although episodic memory and declarative memory are the most severely affected cognitive functions, patients with AD also have varying degrees of executive, language, and visuospatial function impairment [1, 7, 8]. The amyloid cascade hypothesis, which postulates that β-amyloid has a primary role in the pathophysiology, is the most widely accepted [9–12]. Deposition of tau neurofibrillary tangles, which occurs earliest in the medial temporal lobe structures, is another neuropathologic feature of AD. Tau deposition is more directly linked to neurodegeneration than is amyloid deposition, and the hippocampal and medial temporal volume loss in AD is an established structural biomarker of neuronal injury in AD [9, 12–15]. In terms of a biologic definition, amyloid biomarker positivity (Fig. 1) places an individual’s condition on the continuum of AD, but it is the positivity of both amyloid and tau markers that defines AD [9].

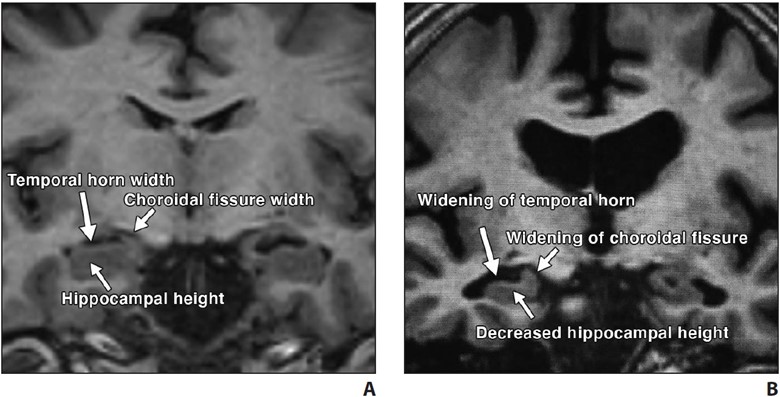
    In typical AD, there is involvement of the medial temporal lobe and lateral temporoparietal cortex, precuneus, and lateral frontal lobe, which is manifested by loss of volume and hypometabolism [16]. The Scheltens scale is widely used for visual rating of hippocampal volume loss [17] (Fig. 2).

    Fig. 2—Visual assessment of hippocampal atrophy performed using Scheltens scale.
    A and B, Coronal T1-weighted MR images of view through hippocampus in patient with normal hippocampus (A) and in patient with mild hippocampal atrophy (B). Visual determination of hippocampal atrophy requires assessment of height of hippocampus, width of choroidal fissure, and width of temporal horn. Note near absence of CSF around hippocampus in patient with normal hippocampus (A) versus decreased hippocampal height and increased width of choroidal fissure and temporal horn in patient with mild hippocampal atrophy (B).

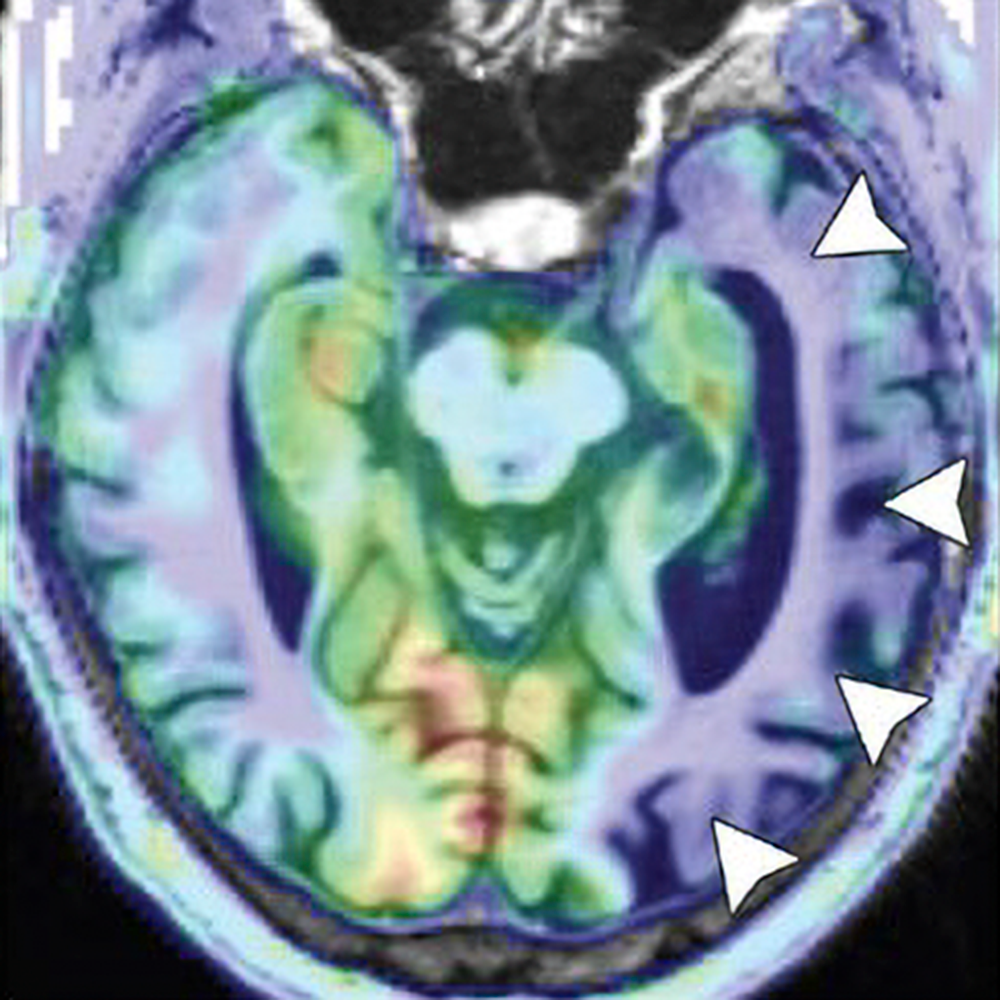
    Hypometabolism of the involved structures is seen on FDG PET, which shows decreased activity in the lateral temporoparietal cortex, posterior cingulate cortex, precuneus, and medial temporal lobe (Fig. 3).

    Fig. 3—FDG PET z-score maps of patient with Alzheimer disease. (Courtesy of Kleefisch C, Medical College of Wisconsin, Milwaukee, WI)
    A–C, Note hypometabolism in temporoparietal (arrows, A), precuneus (white arrow, B), posterior cingulate (black arrow, B), and biparietal (arrows, C) regions.

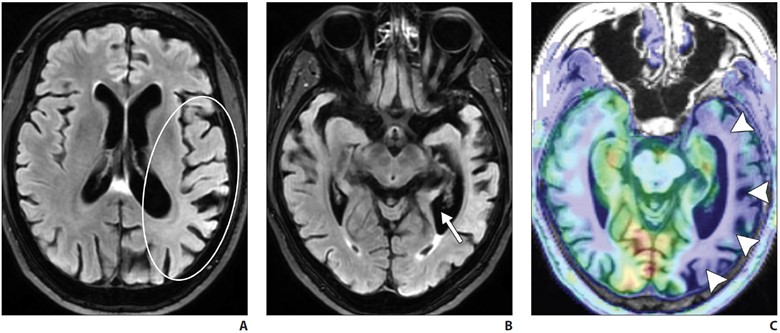
    Logopenic variant primary progressive aphasia (PPA) is the most common atypical presentation of early-onset AD, characterized by predominant language dysfunction. Impaired single-word retrieval and impaired repetition are the core features of logopenic variant PPA [18]. There is a high rate of amyloid and tau positivity [18]. Atrophy is centered at the left temporoparietal junction and the left inferior parietal and superior temporal regions, including the supramarginal and angular gyri, and is associated with concomitant hippocampal volume loss (Fig. 4).

    FDG PET shows temporoparietal hypometabolism (left greater than right) [18].

    Frontotemporal Lobar Degeneration

    Frontotemporal lobar degeneration (FTLD) is a heterogeneous group of disor­ders that typically feature progressive dete­rioration of behavior or language and usu­ally are associated with neurodegeneration in the frontal and temporal lobes. FTLD is most prevalent among individuals 45–64 years old. FTLD includes six subtypes, with three predominant clinical syndromes defining these six subtypes. The most common subtype is a behavioral disorder known as behavioral variant frontotempo­ral degeneration. Language disorders asso­ciated with FTLD include semantic variant PPA and nonfluent or agrammatic variant PPA. Certain motor disorders included in the FTLD classification include progres­sive supranuclear palsy (PSP), corticobas­al degeneration (CBD), and motor neuron disease (MND) [1, 7, 8].

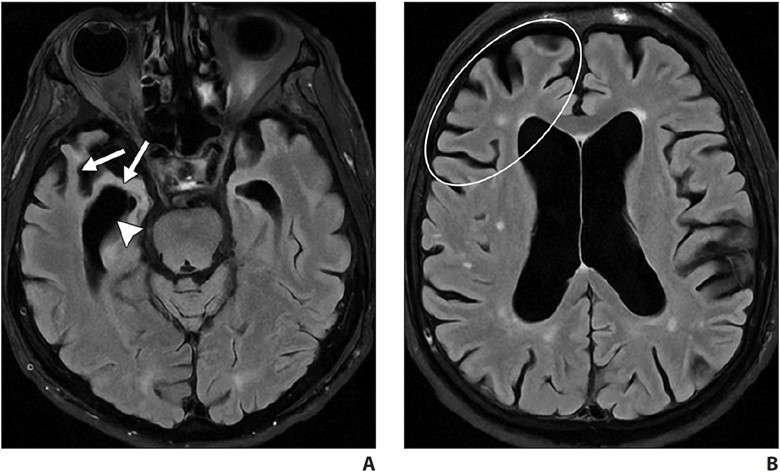
    Behavioral variant frontotemporal de­generation is the most common form of FTLD and is characterized by the gradual onset and progression of changes in per­sonality, behavior, and executive function with relative sparing of memory and visuo­spatial functions (in contrast with AD). The frontal and temporal lobes are characteris­tically involved [7, 19, 20]. MRI shows atrophy with knife-edge gyri. On ASL and FDG PET, there is hypoperfusion and hy­pometabolism of the frontal and temporal lobes (Fig. 5) with relative sparing of the parietal lobes (in contrast with AD).

    Amy­loid PET may also help differentiate FTD from AD, because FTD typically shows no or very little amyloid binding [7, 19–21].

    Semantic variant PPA primarily pres­ents with anomia and single-word compre­hension deficits. Volume loss affects the ventral and lateral portions of the anterior temporal lobes (Fig. 6).

    In most patients, the left hemisphere is predominantly af­fected, although bilateral involvement may be seen. Asymmetric hippocampal volume loss is commonly seen on the side where temporal lobe atrophy is present. Tar DNA-binding protein of 43 kilodaltons (TDP-43) proteinopathy is the most com­mon underlying neuropathology [22, 23].

    Progressive nonfluent aphasia is another type of PPA on the spectrum of FTLD dis­orders and is associated with accumulation of tau proteins [24–27]. There is predomi­nant involvement of the left inferior frontal region, with additional involvement of the anterior insula, prefrontal regions, supple­mentary motor area, and anterosuperior left temporal lobe [24–27].

    Amyotrophic lateral sclerosis (ALS) is part of the FTLD-MND spectrum, with cases primarily presenting with features of either FTD or ALS. Associated FTD is more common in bulbar-onset ALS than in limb-onset ALS, with involvement of the frontal and temporal lobes. Abnormal hyperinten­sity is noted along the corticospinal tracts on T2-weighted and FLAIR MRI, and sus­ceptibility-weighted imaging or gradient-re­called echo (GRE) MRI shows gyriform hy­pointensity along the motor cortexes [28].

    PSP and CBD show mixed features of cognitive impairment and parkinsonism and an underlying tauopathy. Language symptoms, when present, are those of non­fluent or agrammatic variant PPA, which is another tauopathy. Due to the damage to the nigrostriatal dopamine pathway, 123I-FP-CIT (fluoropropyl-carbomethoxy-iodophenyl-tropane) SPECT may show ab­normal reduced uptake in the basal ganglia in PSP and CBD.

    Characteristic volume loss is noted in the brainstem in PSP [19, 29], manifesting as the “hummingbird” appearance on midsagittal images. Although classically described with PSP, the hummingbird sign is subjective and is commonly seen with advanced brain volume loss developing from other causes. Quantitative evaluation, with a midbrain area of less than 70 mm2 on midsagittal images or an anteroposterior diameter of the midbrain of less than 17 mm on axial T2-weighted im­ages suggesting midbrain atrophy, could be useful [30, 31]. PSP also shows volume loss within the superior cerebellar peduncles.

    CBD is rare and is characterized by uni­lateral or asymmetric signs of parkinsonian rigidity, myoclonus, and apraxia. Core clinical features are asymmetric progressive limb dystonia and alien limb phenomenon. The brain is atrophied asymmetrically in the perirolandic region, which is otherwise uncommon in primary neurodegenerative diseases. Other imaging features include unilateral putamen atrophy and increased hypointensity of the globus pallidi and the putamina on T2-weighted MRI and on SWI or GRE MRI. Associated unilateral cerebral peduncle atrophy may also be seen [32].

    Dementia With Lewy Bodies

    Dementia with Lewy bodies (DLB) is the second most common form of neuro­degenerative dementia in individuals older than 65 years old. Recurrent visual hallu­cinations, fluctuating cognition, rapid eye movement sleep behavior disorder, and motor parkinsonism are the core clinical features. DLB can be differentiated from AD by the relative absence of medial tem­poral lobe atrophy [33, 34] and by greater involvement of the posterior parietal and parietooccipital regions. Atrophy within the striatal structures and brainstem is also seen in DLB. ASL and FDG PET studies show hypometabolism in the posterior pa­rietal and occipital regions, with preserva­tion of normal uptake in the medial tem­poral lobe and posterior cingulate gyrus (the cingulate island sign of DLB). Iodine- 123-labeled FP-CIT SPECT, used for im­aging the dopaminergic pathway, may be useful in the workup of patients with DLB, who show decreased uptake of the tracer in the striatum, as seen in other parkinsonian diseases [33, 34].

    Cerebral Amyloid Angiopathy

    Deposition of amyloid-β in the media and adventitia of cerebral cortical and leptomeningeal vessels is the hallmark of cerebral amyloid angiopathy (CAA). The amyloid deposition weakens the vessel wall, leading to rupture and hemorrhage. On imaging, this manifests as a spectrum of foci of intraparenchymal lobar hemor­rhage, convexal subarachnoid hemorrhage, and cortical and subcortical microhemor­rhages. Areas of superficial siderosis are seen, indicative of prior subarachnoid hemorrhage. Subcortical white matter long-TR hyperintensities are typical of CAA differentiated from periventricular lesions seen in hypertensive cerebrovascu­lar disease [35].

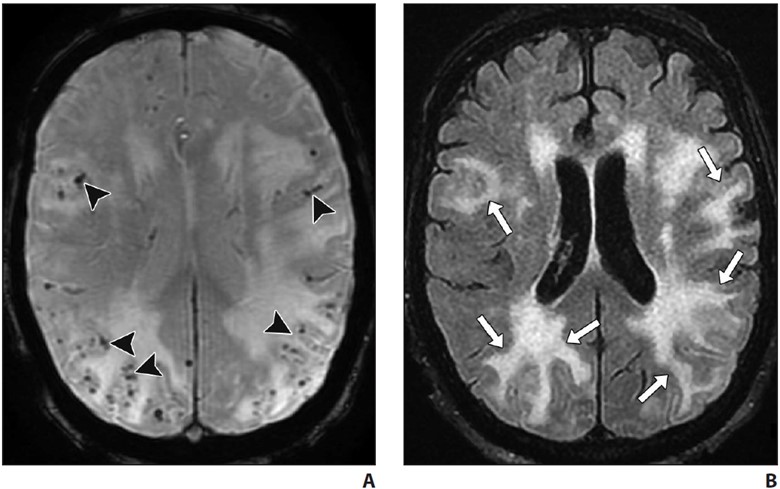
    Acute inflammatory CAA may be seen on a background of chronic changes, in as­sociation with rapidly progressive cognitive decline [36]. On imaging, inflammatory CAA is seen as solitary or multifocal areas of confluent white matter hyperintensity with or without mass effect or patchy areas of enhancement and is often centered around foci of microhemorrhage [36] (Fig. 7).

    Normal Pressure Hydrocephalus

    Primarily an idiopathic disease, NPH is characterized by progressive gait distur­bance, urinary urgency or incontinence, and cognitive impairment. NPH is largely a clin­ical diagnosis, with imaging playing a sup­portive role. Objective measurements such as the Evans ratio or callosal angle have a low accuracy for diagnosis. A dispropor­tionately enlarged subarachnoid space hy­drocephalus imaging pattern, when present, has been shown to have higher accuracy where ventriculomegaly is seen along with effacement of the sulci at the vertex and multifocal enlarged sulci. Hyperdynamism may be seen on CSF flow studies, character­ized by a streak of flow void through the ce­rebral aqueduct that is best seen on sagittal images. Radionuclide cisternography using 111In- or 99mTc-DTPA (diethylenetriamine­pentaacetic acid) may show abnormal tracer reflux into the lateral ventricles and lack of tracer activity over the convexities 24–48 hours after intrathecal injection. A high vol­ume (30–50 mL) of CSF lumbar puncture may show improved gait and cognitive test­ing. Improvement of gait disturbance after lumbar puncture has a high PPV for favor­able postintervention results [37].

    Creutzfeldt-Jakob Disease

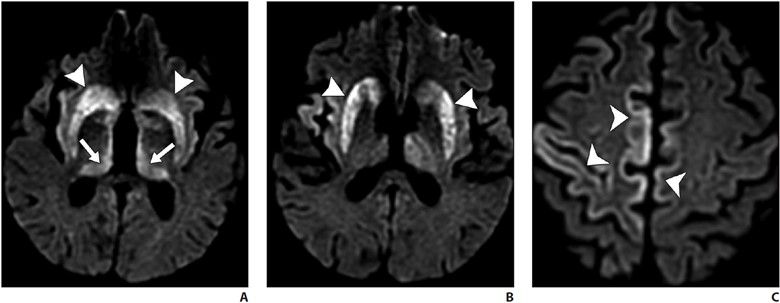
    A fatal prion disease, CJD presents with rapidly progressive dementia, along with myoclonus, pyramidal, extrapyrami­dal, and cerebellar signs. CJD is mostly sporadic, but it can be familial, infectious (variant CJD), or iatrogenic. There is spon­giform degeneration and gliosis. The MRI sequence with the highest sensitivity and specificity is DWI, which shows the char­acteristic imaging finding of hyperinten­sity of the basal ganglia, thalami, and the cortical regions [38, 39] (Fig. 8).

    Symmet­ric involvement of the posterior thalami (pulvinar sign) and the dorsomedial nuclei (hockey-stick sign) is common in vari­ant CJD but can also be seen in sporadic CJD. Bilateral but asymmetric involve­ment of the cortical areas is seen [38, 39]. Enhancement is uncommon. Definitive diagnosis may require brain biopsy. Death ensues in a few months.

    Vascular Contributions to Cognitive Impairment and Dementia

    Cerebrovascular small-vessel disease is a common complication of uncontrolled hypertension, which frequently affects the periventricular white matter seen as white matter hyperintensities on T2 FLAIR im­aging. Hypertensive arteriopathy, amyloid angiopathy, or genetic causes of cerebro­vascular disease (such as cerebral autoso­mal dominant arteriopathy with subcortical infarcts and leukoencephalopathy [CA­DASIL]) can cause cognitive impairment by interrupting brain networks traversing the affected white matter regions [40, 41]. The likelihood of vascular disease contrib­uting to cognitive dysfunction increases with increasing small-vessel disease and infarct burden.

    CADASIL is the most common ge­netic cause of adult-onset cerebrovascular disease. Migraine with aura, stroke, and chronic presentations, such as cognitive de­cline and dementia, are the clinical features. Patients most frequently present in the 3rd decade of life, and most patients present by late middle age. When patients pres­ent earlier than the 3rd decade, subcortical FLAIR white matter hyperintensities are seen, which over the years progress to the characteristic confluent hyperintensities in the anterior temporal poles, superior frontal lobes, and the external capsules [42].

    Deposition of protein aggregates and neuronal loss are the likely cause of cogni­tive decline in neurodegenerative disorders. Protein aggregates such as amyloid and tau can be imaged by amyloid and tau PET, whereas neuronal loss can be shown on MRI and FDG PET. The pattern of protein deposition and neuronal loss may be useful in identifying the type of dementia. Cere­brovascular disease and cerebral amyloid angiopathy can cause cognitive decline on their own or worsen cognitive decline due to other neurodegenerative disorders. NPH, CADASIL, CJD, and other conditions are additional important identifiable causes of cognitive decline on imaging.

    We thank Christopher Kleefisch of the Medical College of Wisconsin for his con­tribution to the PET images.

    References

    1. Gliebus GP. Memory dysfunction. Continuum (Min­neap Minn) 2018; 24:727–744
    2. Plog BA, Nedergaard M. The glymphatic system in central nervous system health and disease: past, present, and future. Annu Rev Pathol 2018; 13:379– 394
    3. Zhang L, Chopp M, Jiang Q, Zhang Z. Role of the glymphatic system in ageing and diabetes melli­tus impaired cognitive function. Stroke Vasc Neurol 2019; 4:90–92
    4. Guo F, Liu X, Cai H, Le W. Autophagy in neurode­generative diseases: pathogenesis and therapy. Brain Pathol 2018; 28:3–13
    5. Alsop DC, Detre JA, Golay X, et al. Recommended implementation of arterial spin-labeled perfusion MRI for clinical applications: a consensus of the ISMRM perfusion study group and the European consortium for ASL in dementia. Magn Reson Med 2015; 73:102–116
    6. Shim G, Choi KY, Kim D, et al. Predicting neurocog­nitive function with hippocampal volumes and DTI metrics in patients with Alzheimer’s dementia and mild cognitive impairment. Brain Behav 2017; 7:e00766
    7. Bhogal P, et al. The common dementias: a pictorial review. Eur Radiol 2013; 23:3405–3417
    8. Tartaglia MC, Vitali P, Migliaccio R, Agosta F, Rosen H. Neuroimaging in Dementia. Continuum (Minneap Minn) 2010; 16:153–175
    9. Jack CR Jr, Bennett DA, Blennow K, et al. NIA-AA research framework: toward a biological definition of Alzheimer’s disease. Alzheimers Dement 2018; 14:535–562
    10. Dolci GAM, Damanti S, Scortihini V, et al. Al­zheimer’s disease diagnosis: discrepancy between clinical, neuroimaging, and cerebrospinal fluid biomarkers criteria in an Italian cohort of geriatric outpatients: a retrospective cross-sectional study. Front Med (Lausanne) 2017; 4:203
    11. McKhann GM, Knopman DS, Chertkow H, et al. The diagnosis of dementia due to Alzheimer’s disease: recommendations from the National Institute on Aging–Alzheimer’s Association workgroups on diagnostic guidelines for Alzheimer’s disease. Alzheimers Dement 2011; 7:263–269
    12. Jack CR Jr, Knopman DS, Jagust WJ, et al. Tracking pathophysiological processes in Alzheimer’s dis­ease: an updated hypothetical model of dynamic biomarkers. Lancet Neurol 2013; 12:207–216
    13. Burnham SC, Coloma PM, Li QX, et al. Application of the NIA-AA research framework: towards a bio­logical definition of Alzheimer’s disease using ce­rebrospinal fluid biomarkers in the AIBL study. J Prev Alzheimers Dis 2019; 6:248–255
    14. Sperling RA, Aisen PS, Beckett LA, et al. Toward de­fining the preclinical stages of Alzheimer’s disease: recommendations from the National Institute on Aging–Alzheimer’s Association workgroups on diagnostic guidelines for Alzheimer’s disease. Alzheimers Dement 2011; 7:280–292
    15. Fox NC, Schott JM. Imaging cerebral atrophy: nor­mal ageing to Alzheimer’s disease. Lancet 2004; 363:392–394
    16. Ferreira D, Verhagen C, Hernández-Cabrera JA, et al. Distinct subtypes of Alzheimer’s disease based on patterns of brain atrophy: longitudinal trajecto­ries and clinical applications. Sci Rep 2017; 7:46263
    17. Scheltens P, Leys D, Barkhof F, et al. Atrophy of medial temporal lobes on MRI in “probable” Al­zheimer’s disease and normal ageing: diagnostic value and neuropsychological correlates. J Neurol Neurosurg Psychiatry 1992; 55:967–972
    18. Rohrer JD, Rossor MN, Warren JD. Alzheimer’s pa­thology in primary progressive aphasia. Neurobiol Aging 2012; 33:744–752
    19. Agosta F, Galantucci S, Magnani G, et al. MRI sig­natures of the frontotemporal lobar degeneration continuum. Hum Brain Mapp 2015; 36:2602–2614
    20. Irwin DJ, Cairns NJ, Grossman M, et al. Frontotem­poral lobar degeneration: defining phenotypic di­versity through personalized medicine. Acta Neu­ropathol 2015; 129:469–491
    21. Meijboom R, Steketee RME, de Koning I, et al. Func­tional connectivity and microstructural white mat­ter changes in phenocopy frontotemporal demen­tia. Eur Radiol 2017; 27:1352–1360
    22. Chen Y, Chen K, Ding J, et al. Brain network for the core deficits of semantic dementia: a neural net­work connectivity–behavior mapping study. Front Hum Neurosci 2017; 11:267
    23. Joubert S, Vallet GT, Montembeault M, et al. Com­prehension of concrete and abstract words in se­mantic variant primary progressive aphasia and Al­zheimer’s disease: a behavioral and neuroimaging study. Brain Lang 2017; 170:93–102
    24. Gorno-Tempini ML, Miller BL. Primary progressive aphasia as a model to study the neurobiology of language. Brain Lang 2013; 127:105
    25. Gorno-Tempini ML, Brambati SM, Ginex V, et al. The logopenic/phonological variant of primary progressive aphasia. Neurology 2008; 71:1227–1234
    26. Gorno-Tempini ML, Dronkers NF, Rankin KP, et al. Cognition and anatomy in three variants of prima­ry progressive aphasia. Ann Neurol 2004; 55:335– 346
    27. Gorno-Tempini ML, Hillis AE, Weintraub S, et al. Classification of primary progressive aphasia and its variants. Neurology 2011; 76:1006–1014
    28. Conte G, Sbaraini S, Morelli C, et al. A susceptibility-weighted imaging qualitative score of the motor cortex may be a useful tool for distinguishing clini­cal phenotypes in amyotrophic lateral sclerosis. Eur Radiol 2021; 31:9
    29. Rohrer JD, Warren JD. Phenotypic signatures of ge­netic frontotemporal dementia. Curr Opin Neurol 2011; 24:542–549
    30. Warmuth-Metz M, Naumann M, Csoti I, Solymosi L. Measurement of the midbrain diameter on routine magnetic resonance imaging: a simple and accu­rate method of differentiating between Parkinson disease and progressive supranuclear palsy. Arch Neurol 2001; 58:1076–1079
    31. Oba H, Yagishita A, Terada H, et al. New and reli­able MRI diagnosis for supranuclear palsy. Neurol­ogy 2005; 64:2050–2055
    32. Saeed U, Compagnone J, Aviv RI, et al. Imaging bio­markers in Parkinson’s disease and Parkinsonian syndromes: current and emerging concepts. Transl Neurodegener 2017; 6:8
    33. Watson R, O’Brien JT, Barber R, Blamire AM. Pat­terns of gray matter atrophy in dementia with Lewy bodies: a voxel-based morphometry study. Int Psychogeriatr 2012; 24:532–543
    34. Watson R, Colloby SJ, Blamire AM, O’Brien JT. Sub­cortical volume changes in dementia with Lewy bodies and Alzheimer’s disease: a comparison with healthy aging. Int Psychogeriatr 2016; 28:529–536
    35. Wardlaw JM, et al. Neuroimaging standards for research into small vessel disease and its contri­bution to ageing and neurodegeneration. Lancet Neurol 2013; 12:822–838
    36. Salvarani C, et al. Imaging findings of cerebral amy­loid angiopathy, Aβ-related angiitis (ABRA), and ce­rebral amyloid angiopathy-related inflammation: a single-institution 25-year experience. Medicine (Baltimore) 2016; 95:e3613
    37. Graff-Radford NR. Normal pressure hydrocephalus. Neurol Clin 2007; 25:809–832
    38. Kallenberg K, Schulz-Schaeffer WJ, Jastrow U, et al. Creutzfeldt-Jakob disease: comparative analysis of MR imaging sequences. AJNR 2006; 27:1459–1462
    39. Tian HJ, Zhang JT, Lang SY, Wang XQ. MRI sequence findings in sporadic Creutzfeldt-Jakob disease. J Clin Neurosci 2010; 17:1378–1380
    40. Koga H, Takashima Y, Murakawa R, Uchino A, Yu­zuriha T, Yao H. Cognitive consequences of mul­tiple lacunes and leukoaraiosis as vascular cogni­tive impairment in community-dwelling elderly individuals. J Stroke Cerebrovasc Dis 18:32–37
    41. Sweeney MD, Montagne A, Sagare AP, et al. Vascular dysfunction: the disregarded partner of Alzheimer’s disease. Alzheimers Dement 2019; 15:158–167
    42. Ferrante EA, Cudrici CD, Boehm M. CADASIL: new advances in basic science and clinical perspectives. Curr Opin Hematol 2019; 26:193–198
  • Can You Learn to Teach? Tips for Improving Instruction

    Can You Learn to Teach? Tips for Improving Instruction

    Published February 22, 2023

    avatar

    David M. Naeger, MD

    Director of Radiology, Denver Health
    Professor and Vice Chair of Radiology

    Who is the best lecturer you have ever watched in radiology? Who else comes to mind when you think of amazing educators throughout your radiology career?

    When you think of those individuals, and then think about the teaching you do, do you sort of think to yourself, “gosh, I am not that good, and I could never be that good?”

    Well, I have some good news for you: those amazing lecturers did not start off that way. None of them. I promise. Great teachers, in radiology and other fields, may have some innate talent, but all great lecturers learned through mentors, feedback, and/or trial and error how to get better, to the point of being great. There are too many aspects to becoming an amazing teacher for it all to happen by chance. Some of the great pioneers in radiology education may not have had formal instruction in pedagogy, but at a minimum, they all were probably attuned to incorporating direct and indirect feedback. And they probably had a strong internal process of improving.

    So, how can you get better at teaching, if you really want to be great?

    First, Seek Formal Resources

    Thankfully, there are many well-written resources available throughout the radiology literature. For example, see Heller and Silva’s excellent primer in the Journal of the American College of Radiology (JACR) for delivering a presentation that is informative, notable, and even inspiring [1].

    One of the best initiatives is ARRS’ own Clinician Educator Development Program (CEDP) [2]. Each year, up to 30 ARRS CEDP recipients are selected to receive a travel grant to attend a specialized on-site workshop during the ARRS Annual Meeting. With a curriculum promising increased proficiency in instructional skills, as well as educational activity design, the CEDP remains a highly interactive day of learning. Focusing on new and emerging pedagogical tools, while improving already acquired clinical acumen, over half of this expertly curated syllabus consists of hands-on learning. Offering a unique opportunity to interact with fellow enthusiastic clinician educators, attendees will engage further with the esteemed faculty ARRS has convened—previous CEDP instructors Travis Henry, MD (Duke) and Aaron Kamer, MD (Indiana), as well as Omer Awan, MD (Maryland), Judith Gadde, DO (Northwestern), and myself—on April 15 during the 2023 Annual Meeting in Honolulu, HI.

    Second, Ask for Feedback

    If your lectures are part of a series where evaluations are collected, then ask for them. If there is no feedback available, see if you can collect some. Try sending out your own survey perhaps? If all else fails, you can ask for feedback from one or multiple people you know who happen to be in the audience. One great option for garnering constructive feedback is asking a mentor who is talented at teaching to attend your lecture, then give you some notes. I know it seems like an imposition, but a good mentor will do this for you.

    Optimally, you are seeking honest answers to the following questions:

    • Did you lose your audience? If so, where?
    • What didactic points could have been explained better?
    • What aspects of your lecture were nearly perfect?
    • Are there insights you should keep to use for future talks?

    Third, Construct Internal Feedback

    Observe lectures from an esteemed imaging educator, asking yourself, “how does this lecture differ from mine?” Experiment with employing a similar style—without copying content, of course—and see if it could work for you. One key observation is that many lectures out there aren’t that great, yet it is incredibly easy to copy the predominant style that is used. Copying a mediocre style will make your lecture just as mediocre, so don’t do that. Look to see what the truly great lecturers in radiology are doing.

    To get your improvement process jumpstarted, right off the bat, allow me to share an immediate tip. For JACR, my colleagues and I examined what made a successful lecture, based upon thousands of comments regarding hundreds of lectures given to medical students [3].

    What was the characteristic most associated with well-received lectures?  

    …Interactivity

    Recently noted by AJR, too, the biggest pro tip is interacting with your audience, even if it seems hard or unconventional [4]. You will want to do so in a warm and inviting way, free of condescension. Adding such an interactive element to your teaching will help you forge a stronger connection with all your learners.

    References:

    1. Heller et al. Preparing and delivering your best radiology lecture. J Am Coll Radiol 2019; 16:745–748
    2. Clinician Educator Development Program. ARRS website. www.ARRS.org/CEDP. Accessed January 17, 2023
    3. Jen A, Webb EM, Ahearn B, Naeger DM. Lecture evaluations by medical students: concepts that correlate with scores. J Am Coll Radiol 2016; 13:72–76
    4. Chien BS, Gunderman RB. In-person interactivity’s vital role in radiology education. AJR 2023; 220:1–2
  • Pitfalls in Elbow Imaging: Osseous Anatomic Variants

    Pitfalls in Elbow Imaging: Osseous Anatomic Variants

    Published January 3, 2023

    avatar

    Neha Antil, MD

    Department of Radiology, Division of Musculoskeletal Imaging
    Stanford University School of Medicine, Center for Academic Medicine

    avatar

    Amelie M. Lutz, MD

    Department of Radiology, Division of Musculoskeletal Imaging
    Stanford University School of Medicine, Center for Academic Medicine

    avatar

    Kathryn J. Stevens, MD

    Department of Radiology, Division of Musculoskeletal Imaging
    Stanford University School of Medicine, Center for Academic Medicine

    Imaging findings in radiology are not always black and white; in between, there are multiple shades of gray. One of the key roles of the radiologist is to identify and differentiate true pathology from pathological mimics that can pose a diagnostic challenge in day-to-day clinical practice. As such, it is important to know the normal imaging anatomy of a joint and be aware of some of the typical anatomic variants that can occur. Most anatomic variants are asymptomatic and are seen as incidental findings on imaging. A few anatomic variants, however, can predispose to symptoms under specific circumstances and can cause pain, sensory loss, or restricted joint function. 

    In advance of the 2023 ARRS Annual Meeting Categorical Course, “Pitfalls and Challenging Cases: How to Triumph and Make the Diagnosis,” this InPractice article focuses on anatomic variants occurring in and around the elbow and some of the potential pitfalls to be aware of when reading imaging studies. 

    Normal Anatomy

    The elbow is a complex synovial joint formed by the articulation of the distal humerus, proximal radius, and proximal ulna. The bones form three separate joints—the humeroulnar, radiocapitellar, and proximal radioulnar joints—contained within a single joint capsule lined with synovium and supported by groups of muscles, tendons, and ligaments [1–3]. The humeroulnar joint is a hinge joint formed between the humeral trochlea and the sigmoid notch of the ulna. The sigmoid notch of the ulna (also known as the trochlear notch or groove or semilunar notch) is a crescent-shaped depression along the proximal ulna lined with articular cartilage [1–4]. The radiocapitellar joint is the articulation between the humeral capitellum and radial head. The radial head has a central concavity that allows smooth articulation with the rounded, anteriorly directed capitellum or capitulum of the humerus. The surfaces of both the radial head and capitellum are covered with hyaline cartilage [1, 2]. The proximal radioulnar joint is formed by the radial head and radial notch (or lesser sigmoid notch) of the proximal ulna, which is a shallow depression distal and lateral to the coronoid process [1–3].  

    Osseous Anatomic Variants 

    Supracondylar Process 

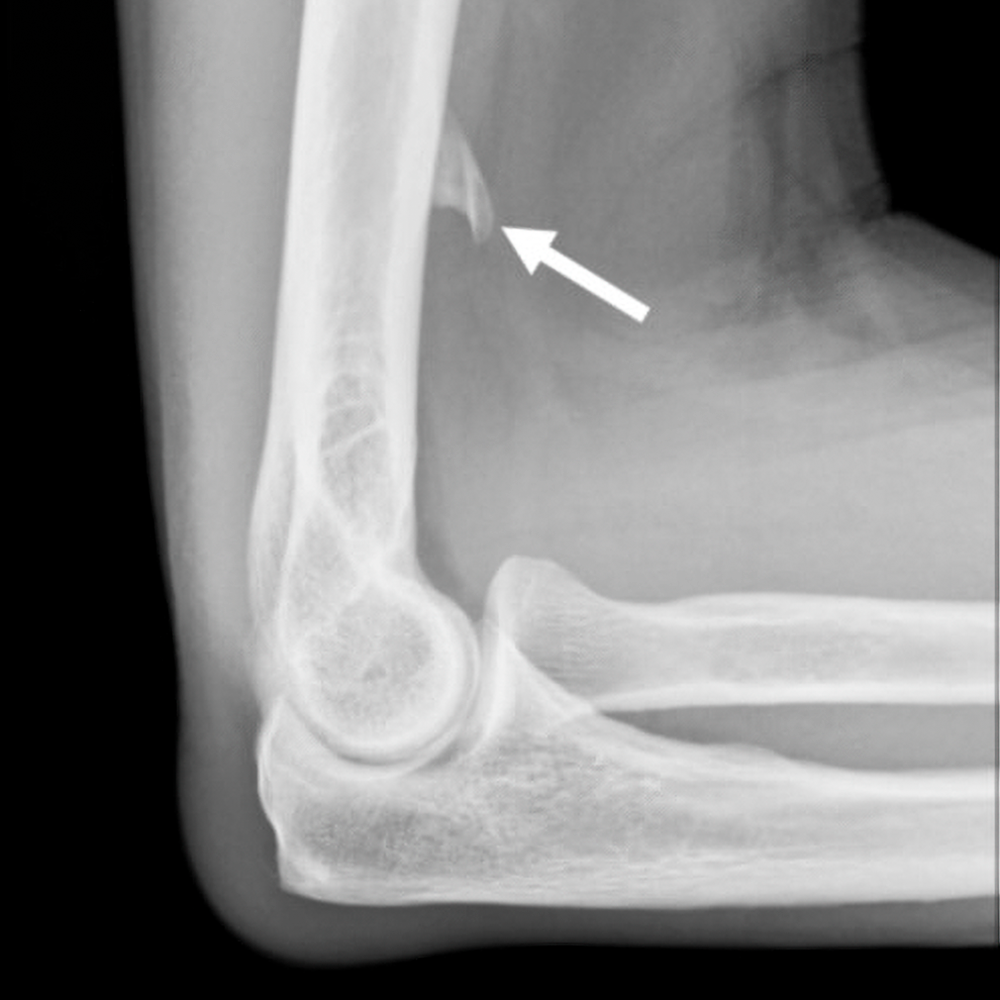
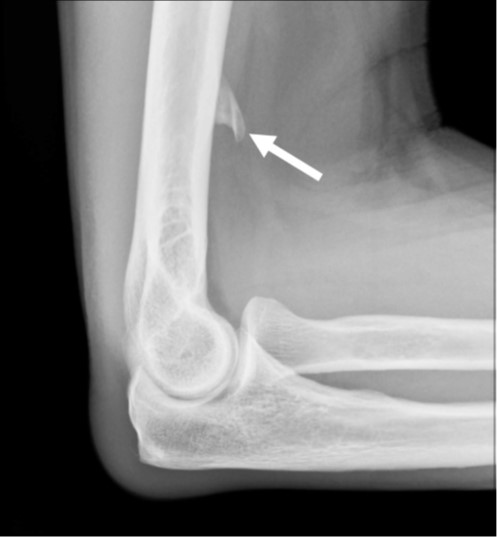
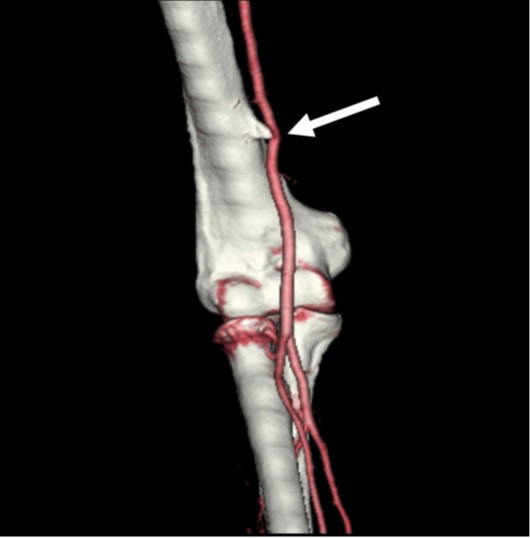
    The supracondylar process, or avian spur, is a congenital bony protuberance along the anteromedial aspect of the distal humerus. It ranges in size from 2 to 20 mm and is located 5–7 cm above the medial epicondyle. The spur grows toward the elbow, unlike an osteochondroma, which is directed away from the elbow. A supracondylar process is present in 1–3% of the population, more commonly found in men and boys and on the left [2, 3]. The spur may be connected to the medial epicondyle by a fibrous band called the Struthers ligament, which creates a fibroosseous tunnel. A supracondylar process is usually asymptomatic but can fracture or cause mechanical compression of the median nerve or brachial artery, where the neurovascular bundle passes through the fibroosseous tunnel formed by the supracondylar process and Struthers ligament. The symptoms include pain, paresthesia, and weakness in the distribution of the median nerve and can be aggravated by continuous movement or local compression at the elbow [1, 2]. 

    A supracondylar process can be seen on lateral or oblique radiographs obtained with the elbow internally rotated and can be misinterpreted as a bony exostosis or osteochondroma. However, the typical location of the supracondylar process along the anteromedial aspect of the distal humerus and direction of growth toward the joint differentiate it from an osteochondroma, which typically occurs in the metaphysis and grows away from elbow (Fig. 1A). CT angiography can show the supracondylar process and deviation, compression, or thrombosis of the brachial artery (Fig. 1B). MRI and ultrasound can depict the Struthers ligament and any compression on the neurovascular bundle. Surgical decompression is usually the preferred approach over conservative treatment of patients who have symptoms [1–8]. 

    Supratrochlear Foramen 

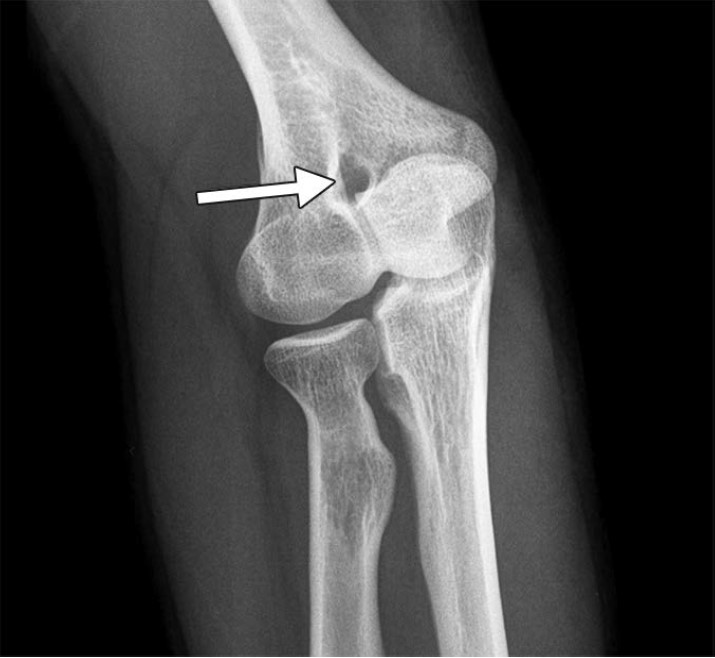
    In the supratrochlear portion of the distal humerus, a thin plate of compact bone called the supratrochlear septum usually separates the olecranon and coronoid fossae. This bony septum can be opaque or radiolucent, is lined by a synovial membrane, and is present until approximately age 7. After this time, it is occasionally absorbed, forming a supratrochlear foramen (also known as the olecranon foramen, septal aperture, intercondylar foramen, and epitrochlear foramen) [3]. It is important to report the presence of a supratrochlear foramen (Fig. 2) and provide information about the shape and dimensions, because these factors can influence preoperative planning and surgical outcome. The presence of a supratrochlear foramen is commonly associated with a narrow medullary canal and anterior angulation of the distal humerus and gracile bones, which can predispose to fracture when instrumentation is placed in the distal humerus. Additionally, a large supratrochlear foramen may be misinterpreted as an osteolytic or cystic lesion, if the radiologist is unaware of this normal variant [9–12]. 

    Pseudodefect of the Capitellum 

    The capitellum is a hemispherical protuberance along the anterior and lateral aspects of the distal humerus. The anterior 180° of the capitellum is round, smooth, and covered by articular cartilage. As the capitellum curves distally and posteriorly, it tapers in width. The posterolateral aspect of the capitellum is devoid of articular cartilage and often has a rough and irregular appearance. A groove is normally present between the posterolateral aspect of the capitellum and the lateral epicondyle [3, 4].  

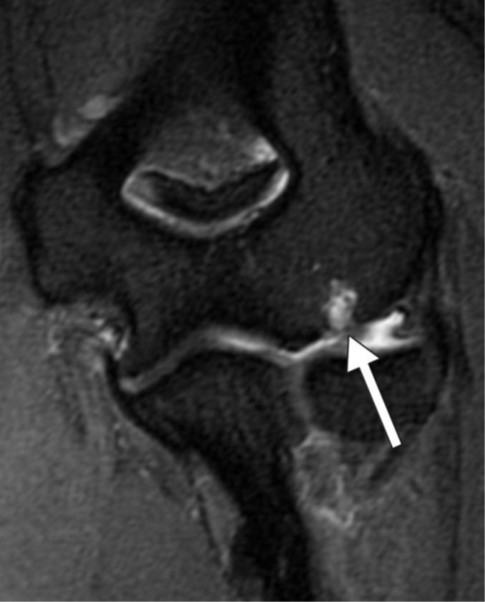
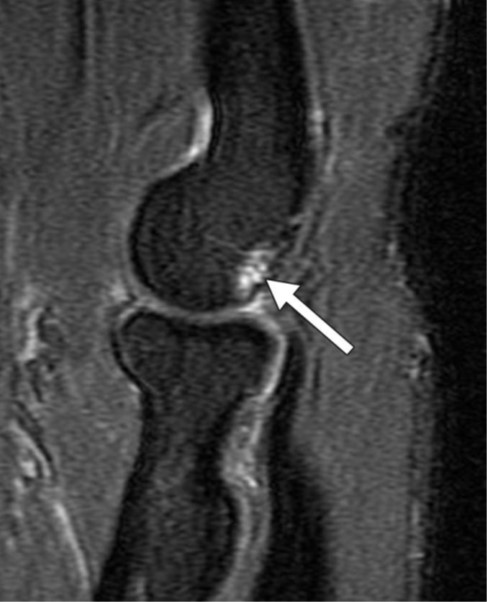
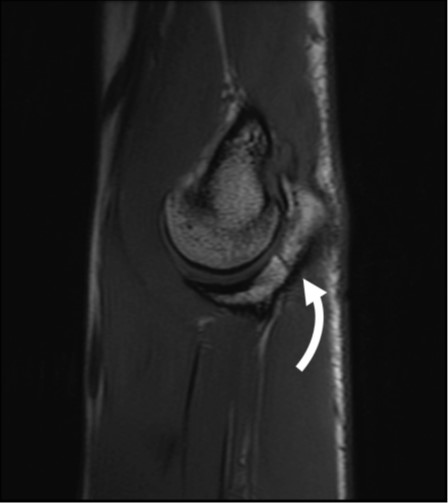
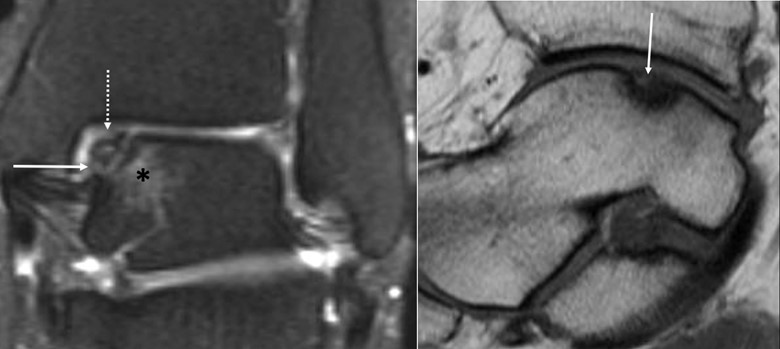
    The abrupt change in contour of the articular capitellum at the junction with the lateral epicondyle can create a pseudodefect of the capitellum on coronal MR images. This finding is more pronounced in contrast to the smooth articular surface of the radial head or in the presence of a joint effusion where fluid outlines the groove. The pseudodefect can simulate an osteochondral lesion, particularly when there is accompanying fibrocystic change. However, the two can easily be distinguished by their anatomic location on sagittal images: the pseudodefect will be along the posterior nonarticular surface of the capitellum (Fig. 3), whereas an osteochondral lesion will be located along the anterior capitellum and is commonly accompanied by subchondral cystic change, bone marrow edema, and a joint effusion [1–4]. 

    Pseudodefect of the Trochlear Groove

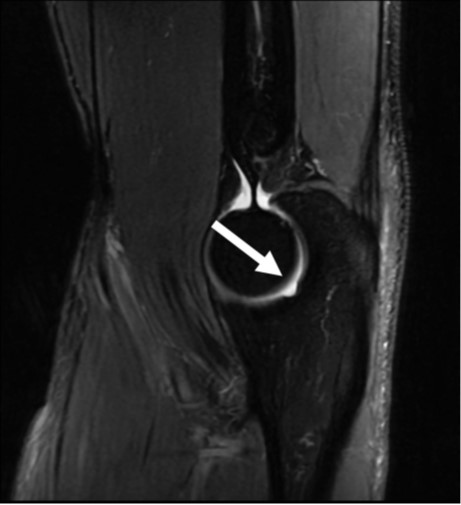
    The trochlear groove is constricted at the junction of the olecranon and coracoid process with inward tapering that results in subtle cortical notches peripherally, which can simulate cortical disruption on sagittal MR images. These pseudodefects of the trochlear groove can simulate a fracture (Fig. 4). However, the well-defined margins, absence of bone marrow edema, and midtrochlear location differentiate the pseudodefect from a true fracture, which usually extends into the medullary cavity [1, 2, 13]. 

    Transverse Trochlear Ridges 

    The midtrochlear groove is partially or completely traversed by a nonarticular transverse bony ridge at the junction of the olecranon process and coronoid process. The bony ridge is devoid of articular cartilage and best seen on sagittal MR images. The bony elevation may be misinterpreted as an intraarticular osteophyte or sequela of a healed fracture; however, the absence of bone marrow edema and characteristic location help differentiate the midtrochlear groove from pathology [1, 3, 4, 13]. 

    Accessory Ossicles  

    Patella cubiti—A patella cubiti (also known as an os sesamum cubiti or os sesamoideum tricipitale) is a rare sesamoid bone located within the distal triceps brachii tendon that develops when part of the olecranon or the entire olecranon remains separated from the proximal ulna [3]. On radiographs, the patella cubiti is seen as a well-corticated ossicle with a smooth contour adjacent to the olecranon process. The ossicle can mimic an ununited avulsion fracture of the olecranon tip or a nonunited olecranon apophysis. However, a history of trauma and the presence of irregular sclerotic margins in both the parent bone and fracture fragment favors a chronic fracture. In preadolescent or adolescent athletes involved in overhead throwing activities, such as baseball, a widened physis and sclerotic margins on imaging favor an ununited olecranon apophysis [14–16]. A fractured olecranon enthesophyte or calcium hydroxyapatite deposition in the distal triceps tendon can also mimic a patella cubiti [3].

    Os supratrochleare dorsale—The os supratrochleare dorsale is an accessory ossicle found in the olecranon fossa; it is commonly seen in the dominant arm of men and boys age 15–40 [1, 17]. Its appearance has been described as a medallion on a frontal radiograph. This finding is characterized by a thick sclerotic border of bone around an ossicle related to stress changes with a thin rim of surrounding lucency due to deepening of the olecranon fossa. Repetitive impaction by the olecranon process during elbow extension can lead to osseous remodeling or fragmentation of the os with secondary osteoarthritis. It is important to differentiate the os supratrochleare dorsale from its common mimickers, such as patella cubiti, intraarticular joint body, and fragmentation of the olecranon tip in patients with valgus extension overload. Surgical removal is the treatment of choice of both os supratrochleare dorsale and the joint body [1, 17].

    Prominent Radial Tuberosity 

    The radial tuberosity along the ulnar aspect of the proximal radius serves as the attachment site of the distal biceps tendon. Cancellous bony trabeculae are sparse subjacent to the radial tuberosity and may produce an exuberant or bubbly osseous prominence that can simulate a pathologic lucent lesion when seen en face on radiographs. An adjacent osseous fossa anterolateral to the biceps tendon insertion can also appear lucent when seen en face. Knowledge of the distal biceps insertional anatomy can prevent mistaking this physiologic structure for a lucent bone lesion [18].

    Offering 18 total CME credits for ARRS members, the “Pitfalls and Challenging Cases: How to Triumph and Make the Diagnosis” Categorical Course will also tackle challenging cases in abdominal, chest, and neuroradiology. Didactic lectures will emphasize clinical scenarios and interpretative skills across a true diversity of findings, enhancing the radiologist’s role in patient management. Together, we look forward to presenting more information—especially about nonosseous normal variants in elbow imaging—during the “Pitfalls in Upper Extremity in MSK Imaging” session at the ARRS Annual Meeting Categorical Course. Please join us and other expert faculty in Honolulu, virtually, or on demand to help diagnose your future shoulder, wrist, and hand imaging cases, too.  

    References

    1. Tomsick SD, Petersen BD. Normal anatomy and anatomical variants of the elbow. Semin Musculoskelet Radiol 2010; 14:379–393 
    2. Stein JM, Cook TS, Simonson S, Kim W. Normal and variant anatomy of the elbow on magnetic resonance imaging. Magn Reson Imaging Clin N Am 2011; 19:609–619 
    3. Antil N, Stevens KJ, Lutz AM. Elbow imaging: variants and asymptomatic findings. Semin Musculoskelet Radiol 2021; 25:546–557 
    4. Rosenberg ZS, Bencardino J, Beltran J. MR imaging of normal variants and interpretation pitfalls of the elbow. Magn Reson Imaging Clin N Am 1997; 5:481–499 
    5. Shon HC, Park JK, Kim DS, Kang SW, Kim KJ, Hong SH. Supracondylar process syndrome: two cases of median nerve neuropathy due to compression by the ligament of Struthers. J Pain Res 2018; 11:803–807 
    6. Grayson DE. The elbow: Radiographic imaging pearls and pitfalls. Semin Roentgenol 2005; 40:223–247 
    7. Newman A. The supracondylar process and its fracture. AJR 1969; 105:844–849 
    8. Pećina M, Borić I, Antičević D. Intraoperatively proven anomalous Struthers’ ligament diagnosed by MRI. Skeletal Radiol 2002; 31:532–535 
    9. Singhal S, Rao V. Supratrochlear foramen of the humerus. Anat Sci Int 2007; 82:105–107 
    10. Erdogmus S, Guler M, Eroglu S, Duran N. The importance of the supratrochlear foramen of the humerus in humans: an anatomical study. Med Sci Monit 2014; 20:2643–2650 
    11. Hirsch IS. On a foramen in the lower extremity of the humerus. Radiology 1928; 10:199–208 
    12. Nayak SR, Das S, Krishnamurthy A, Prabhu LV, Potu BK. Supratrochlear foramen of the humerus: an anatomico-radiological study with clinical implications. Ups J Med Sci 2009; 114:90–94 
    13. Rosenberg ZS, Beltran J, Cheung Y, Broker M. MR imaging of the elbow: normal variant and potential diagnostic pitfalls of the trochlear groove and cubital tunnel. AJR 1995; 164:415–418 
    14. Mittal R, Kumar VS, Gupta T. Patella cubiti: a case report and literature review. Arch Orthop Trauma Surg 2014; 134:467–471 
    15. Khomarwut K, Sutthisast W, Vasuntaraporn U, Arpornchayanon O. Bilateral patellar cubiti: a case report. Bangk Med J 2019; 15:91–93 
    16. Pavlov H, Torg JS, Jacobs B, Vigorita V. Nonunion of olecranon epiphysis: two cases in adolescent baseball pitchers. AJR 1981; 136:819–820 
    17. Obermann WR, Loose HW. The os supratrochleare dorsale: a normal variant that may cause symptoms. AJR 1983; 141:123–127 
    18. Freyschmidt J, Sternberg A, Brossmann J, Wiens J. Koehler/Zimmer’s borderlands of normal and early pathological findings in skeletal radiography, 5th ed. Thieme, 2003
  • A Lighthouse for Radiology Wellness

    A Lighthouse for Radiology Wellness

    Published November 14, 2022

    avatar

    Jonathan Kruskal, MD, PhD

    Melvin E. Clouse Professor of Radiology, Harvard Medical School
    Chair, Department of Radiology, Beth Israel Deaconess Medical Center

    avatar

    Lea Azour, MD

    Clinical Assistant Professor, Department of Radiology, NYU Grossman School of Medicine
    Director of Wellness, Department of Radiology

    avatar

    Jonathan Goldin, MD, PhD

    Professor of Radiology, Medicine, and Biomedical Physics, UCLA David Geffen School of Medicine

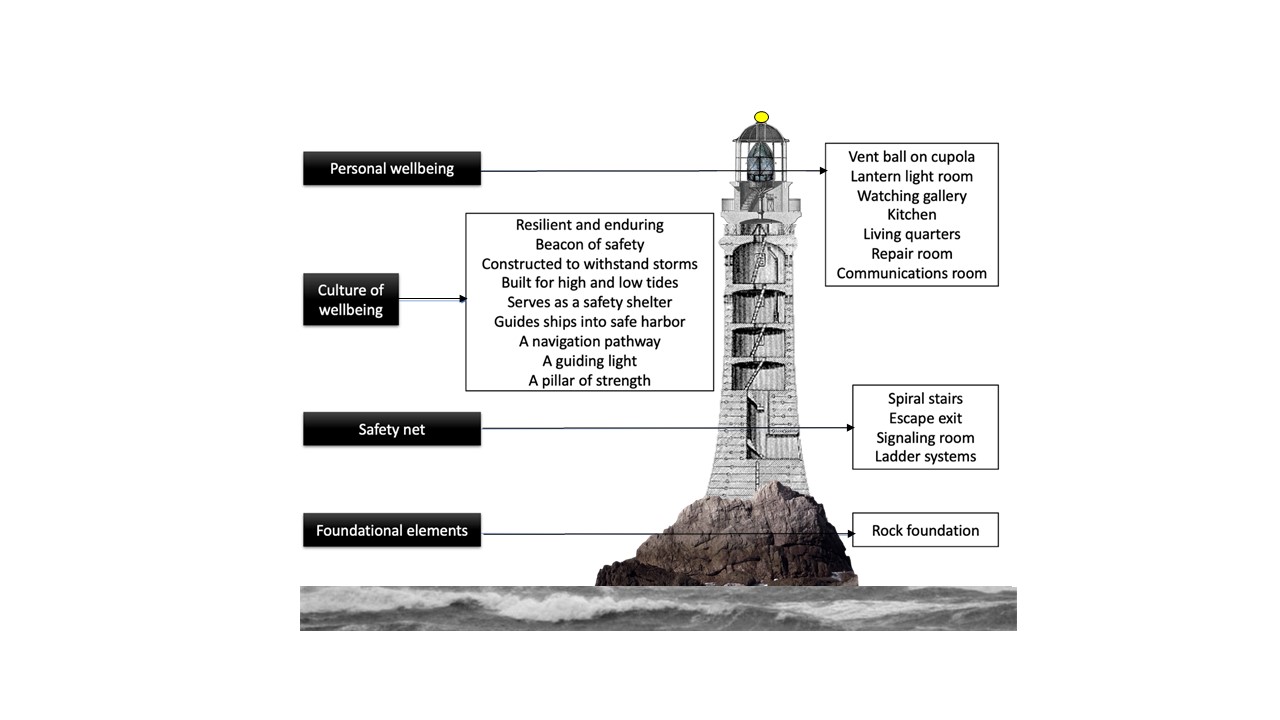
    Imagine for a moment a lighthouse, perhaps alone among cold, crashing waves casting light and deep, bellowing sounds for passing ships in the foggy night. A beacon of safety, of hope, a navigation pathway, guiding distant faceless and shrouded ships through dark and treacherous passages into safe harbors and beyond. No expressions of gratitude or appreciation for this pillar of rock and time and relief. Sturdily constructed on a foundation of bedrock, built to survive the daily ebbs of moon-pulled tides and cruelly lashing, crashing cold storms. When activated, light-generated heat escapes from the lantern light room through vent balls on top of the cupola. Passing ship horns are spied from the watching gallery deck, which sits atop the cramped living quarters and the kitchen, repair, exercise, and communications rooms. Our tall tower is constructed to meet the many personal needs of the timeless keeper, all alone. Hanging ladders, spiral stairs, a signaling room, escape exits, and tide-safe entrances provide safety nets of protection against battering tides and time and loneliness

    So, where are we going with this analogy? In our opinion, the lighthouse symbolizes the four essential ingredients of a wellbeing strategy: foundational elements, safety nets, as well as cultural and personal wellbeing [Fig. 1].

    Let’s consider and expand on components and opportunities encapsulated within the four ingredients below. We invite ARRS members and your colleagues to do the same. For those who might not be experiencing optimal fulfillment in work at this time, do you have your proverbial lighthouse? Might you have colleagues who would clearly benefit from you serving in this capacity?

    Foundational Elements

    In the clinical imaging realm, foundational elements include a redesign of the work environment itself, as well as reliable assessment tools to provide longitudinal estimates of individual states of wellbeing and the impacts of burnout mitigation efforts. We must recognize that to make real change in individual wellbeing, the foundation must be rebuilt. We are well aware of the impacts of leadership effectiveness (or lack thereof!) on staff morale and burnout [1], and on the importance of building collaborations and providing opportunities for social connections. We can all easily list those several “pebbles in our shoes” that detract from our professional fulfillment and may result in additional negative impacts. An important foundational component is the ability to identify, then remove these pebbles effectively, and to keep them out. Don’t we all aspire to be pebble-removal scientists? Examples of the many recognized “pebbles” in our radiologist’s shoes include call requirements, compensation plans, staffing challenges, malpractice risks, work isolation, job security, low meaning in work, clerical burdens, and inefficient work environment. This list is much longer.

    Safety Nets

    The stigmas associated with burnout, stress, and mental health among physicians is harmful and underserved.We offer up simple advice: providing top-level care to our patients requires first that we do the same to ourselves. Simply said, always put your own mask on first. Has your practice invested in developing wellbeing peer support? Who really checks in on you at work? Who do you check in on at work, and what training did you receive for this? We’d suggest reminding yourself how to provide stress first aid, both for peer support and self-care [2]. Consider the “first-aid” that a lighthouse provides, correlated with options for managing sources of anxiety in health care professionals during challenging times [3]. We are all experiencing: “hear me, protect me, prepare me, support me, and care for me.”

    Personal Dimensions of Wellbeing

    An intricate list of dimensions contributes to our overall wellbeing: emotional, psychological, financial, social, spiritual, occupational, physical, intellectual, and environmental. Each of these, while complex and complicated, embraces a wide expanse of opportunities for fostering a state of wellbeing. One cannot just address each individually in isolation, but collectively. For example, the symptoms of burnout include emotional detachment, and might easily overlap those of clinical depression, and both conditions have fundamentally different treatment approaches [4].

    Instilling a Culture of Wellbeing

    Finally, instilling a culture of wellbeing is not quite as simple as the title suggests. Instilling this culture implies prioritizing employee wellness, being open and transparent about goals, sharing a roadmap of progress, embracing different opinions—especially from our multigenerational workforce [5]—and commitment from and active participation by leaders. Efforts should be made to align values with those of the larger organization. This helps employees to find and experience meaning and joy in work, to build a sense of community and collegiality, to ensure that employees feel valued, to show compassion and appreciation, to ensure that policies support wellbeing, such as flexible work and transparency, to resource and provide efficient workflow solutions, to enable all employees to be heard. The list goes on, of course.

    Above, we have briefly addressed the four components of a radiologist wellbeing strategy, certainly not comprehensively, but intended to stimulate conversation, consideration, and contemplation. We are convinced that there will be as many putative suggestions as there are practices. And we plan to continue this conversation this April 16–18, 2023, during the inaugural ARRS Radiology Wellness Summit in Honolulu, HI [6]. A final thought to consider: Is the House of Radiology ready, willing, and resourced to serve as our wellbeing lighthouse?

    References:

    1. Kadom N. Anything Goes—Is It True for Leadership Styles? ARRS Rad Teams website. RadTeams.org/2022/09/26/leadership-styles-radiology-teams. Published September 1, 2022. Accessed November 9, 2022
    2. Westphal RJ, Watson P. Stress First Aid for Health Care Professionals. AMA website. edhub.ama-assn.org/steps-forward/module/2779767. Accessed November 9, 2022
    3. Shanafelt T et al. Understanding and addressing sources of anxiety among health care professionals during the COVID-19 pandemic. JAMA 2020; 323:2133–2134
    4. Sen S. Is it burnout or depression? expanding efforts to improve physician Well-Being. N Engl J Med 2022; 387:1629–1630
    5. Kruskal J. Thriving in a Multigenerational Workforce. ARRS InPractice website.   www.radfyi.org/multigenerational-workforce-radiology-age-diversity-dei. Published January 5, 2022. Accessed November 9, 2022
    6. Kruskal J, Azour L, Goldin J. Introducing the ARRS Radiology Wellness Summit in Hawaii—Time to Get Serious! ARRS InPractice website. www.radfyi.org/radiology-wellness-summit-arrs-2023-hawaii. Published August 1, 2022. Accessed November 9, 2022
  • Repairing the World

    Repairing the World

    Published November 4, 2022

    avatar

    Gary J. Whitman

    2022–2023 ARRS President

    In our current topsy-turvy world, characterized by political divisiveness, challenges to reproductive rights, gun violence, global warming, and the Russia-Ukraine War, how can we improve our state of affairs? With so many problems, where do we begin? Should we just acquiesce and retreat to our comfortable cocoons?

    As radiologists and as members of the American Roentgen Ray Society (ARRS), I believe that we have an obligation to repair and improve the world. Repairing the world is the ancient Jewish concept of tikkun olam—based on acts of kindness. While we may be unable to solve every problem, we can try to repair our world by working towards the betterment of our patients, our colleagues, and ourselves [1].

    As we aim to improve our spheres of influence, our three main tools are kindness, improved communication, and flexibility. Kindness goes a long way in establishing human connections. Improved communication can solve a lot of problems, as many problems arise mainly from impaired communication. Flexibility is critical as we try to emerge from the COVID-19 pandemic. Just think of all the changes in our lives and our world since January 10, 2020, when the World Health Organization announced that a disease outbreak in Wuhan, China was caused by the 2019 novel coronavirus [2].  Furthermore, flexibility is critical as practice patterns and organizational structures change. John Wooden, the record-setting coach of the men’s basketball team at the University of California, Los Angeles, noted that “things work out best for those who make the best of the ways things turn out” [3].

    Working towards the betterment of our patients reinforces the notion that we as radiologists are not film critics; rather, we are physicians actively engaged in clinical care, consulting with other health professionals and advocating for our patients. What we do each and every day—interpreting images and performing image-guided procedures—affects nearly all of our patients in nearly every area of medicine. In other words, our patients and many of our clinical colleagues would be lost without us.  Just think of our role in patient care, with major roles in diagnosis, staging, screening, monitoring response to therapy, predicting prognosis, and risk assessment. In fact, what we as radiologists do every day has a major impact on what treatments are given and what surgeries are performed.

    As we go about our daily work, we can always do a better job at doing our jobs, including making life better for our colleagues. Small acts of kindness can have major positive impacts. Even though we are all busy, taking a little time to engage with others can be helpful in establishing a collaborative milieu. As we talk with each other and establish dialogues, we will probably find that we have more in common that we might have thought. Furthermore, you probably do not want to be the person who reaches out to others ONLY when you need something.

    As we live our lives, inside and outside of radiology, it is important that we take care of ourselves. In 2022, about half of all practicing radiologists endorsed symptoms of burnout—a state of chronic physical and mental exhaustion, increased negativity or cynicism, and reduced professional efficacy, due to an imbalance between occupational demands and available resources [4, 5]. Burnout may be exacerbated by radiologists’ isolation in an environment with low ambient lighting and pressure to read cases and finalize reports quickly [5].

    We need to take care of ourselves, our colleagues, and our patients. If we are physically and mentally exhausted, we will be less effective as radiologists and as members of our communities and our families. I hope that you will join us for the 2023 ARRS Annual Meeting, April 16–20, in beautiful Honolulu, HI (with virtual and on-demand programing). During the Annual Meeting, we will feature the first-ever Radiology Wellness Summit, directed by Drs. Jonathan Kruskal, Lea Azour, and Jonathan Goldin. Our Summit will be a great program, and all of us have a lot to learn about workplace wellness from an individual, as well as an institutional perspective.

    Even though our challenges are weighty, we can and should strive to repair and improve the world. With kindness, improved communication, and flexibility, we can make the world better for our patients, our colleagues, and ourselves. In fact, according to the Talmud and the Quran, whoever saves a single life is considered to have saved the whole world [6, 7]. We can and should incorporate tikkun olam into our busy, hectic, unpredictable lives. We can repair the world. Every (small) act helps. The time is now. As Rabbi Hillel said, “if not now, when?” [8].

    References

    1. Fine L. The Pittsburgh Attack Inspired Calls for Tikkun Olam. What to Know About the Evolution of an Influential Jewish Idea. TIME Magazine website. time.com/5441818/pittsburgh-tikkun-olam-history. Published November 1, 2018. Accessed November 3, 2022
    2. CDC Museum COVID-19 Timeline. Centers for Disease Control and Prevention website. www.cdc.gov/museum/timeline/covid19.html. Updated August 16, 2022. Accessed November 3, 2022
    3. Impelman C. Make the Best of the Way Things Turn Out. The Wooden Effect website. www.thewoodeneffect.com/make-the-best-of-the-way-things-turn-out. Published October 23, 2019. Accessed November 3, 2022
    4. Baggett SM, Martin KL. Medscape Radiologist Lifestyle, Happiness, & Burnout Report 2022. Medscape website. www.medscape.com/slideshow/2022-lifestyle-radiologist-6014784. Published February 18, 2022. Accessed November 3, 2022
    5. Le RT, Sifrig B, Chesire D, Hernandez M, Kee-Sampson J, Matteo J, Meyer TE. Comparative analysis of radiology trainee burnout using the Maslach Burnout Inventory and Oldenburg Burnout Inventory. Acad Radiol 2022; 25:S1076-6332(22)00467-6
    6. Moskovitz D. Save One Life, Save the Entire World (Including Yourself). Religious Action Center website. rac.org/blog/save-one-life-save-entire-world-including-yourself. Published May 24, 2019. Accessed November 3, 2022
    7. Mawdudi SAA. Human Rights in Islam, Chapter 2: Basic Human Rights. Al-Islam website. www.al-islam.org/al-tawhid/vol-4-n-3/human-rights-islam-syed-abul-ala-mawdudi/chapter-2-basic-human-rights. Published May 24, 2019. Accessed November 3, 2022
    8. Kansky M. “If I am not for myself, who will be for me?” A discussion for developing a practice of self-care. Hillel International website. www.hillel.org/about/news-views/news-views—blog/news-and-views/2017/02/28/-if-i-am-not-for-myself-who-will-be-for-me-a-discussion-for-developing-a-practice-of-self-care. Published February 28, 2017. Accessed November 3, 2022
  • Americans, South Koreans Respond to Paradigm Changes in Tumor Assessment

    Americans, South Koreans Respond to Paradigm Changes in Tumor Assessment

    Published November 4, 2022

    avatar

    Kevin Chang, MD

    Associate Professor, Radiology
    Boston University Medical Center

    Course Director
    2023 ARRS Global Exchange Featuring Korean Society of Radiology
    (대한방사선학회)

    The mission of ARRS’ Global Partner Society (GPS) program is to build long-standing relationships with key leaders and organizations in the worldwide imaging community—increasing awareness of our society’s services in specific nations, while raising the stature of Global Partner Societies among ARRS members. Every year, the ARRS Annual Meeting Global Exchange incorporates one partner society into the educational and social fabric of our meeting. ARRS members then reciprocate at the partner society’s meeting that same year.

    The GPS partner to be featured at the 2023 ARRS Annual Meeting on the stunning island of Oahu in Honolulu, HI, will be our longtime colleagues from the Korean Society of Radiology (KSR). Established in 1945, KSR remains the official society representing all physicians of Korea working in the field of radiology. With a membership of more than 3,000 practicing imaging professionals—including 500 in-training members—KSR also publishes two scholarly journals: the Korean Journal of Radiology and Journal of the Korean Society of Radiology.

    The 2023 ARRS Global Exchange Featuring KSR, “Changing Paradigms in Tumor Response Assessment,” will be the latest in a very long succession of successful educational partnerships between the Americans and Koreans. These two vaunted societies joined forces to present a GPS symposium on breast imaging back in 2017. For that fourth KSR/ARRS online collaboration, respective faculty curated 15 lectures across five breast imaging topics that were delivered during the 72nd Korean Congress of Radiology and the 2016 ARRS Annual Meeting in Los Angeles, CA [1].   

    On Sunday, April 16, live, virtually, and on-demand from Hawaii, the ARRS Annual Global Exchange Program will deliver a panel of experts from both the United States and Korea discussing a variety of topics and approaches regarding the quickly evolving role of radiologists in tumor response assessment. All participants, regardless of registration type, will gain functional familiarity with treatment response criteria across a wide swath of tumors, treatments, and techniques, learning from esteemed ARRS faculty from Brigham & Women’s Hospital, Memorial Sloan Kettering Cancer Center, and Rhode Island Hospital. I know I speak for the entire ARRS leadership and membership when I note how much we are all looking forward to hosting KSR’s leading experts from Seoul National University Hospital, Yonsei University Health System, Soonchunhyang University College of Medicine, and the Catholic University of Korea. Our Korean friends will help us understand locoregional treatment response evaluation for hepatocellular carcinoma (HCC).

    Immune Checkpoints: No Inhibitions?

    Be it in America, across the Pacific, or anywhere else in the world for that matter, a chief radiological concern moving forward is recognizing the spectrum of responses and progressive diseases typically encountered in patients treated with immunotherapies, especially immune checkpoint inhibitors (ICI). Right now, indications for ICI therapy already include more than 16 different cancers. As this number will only continue to increase in the coming years, academic and private practice imagers (in addition to radiology residents and fellows) need to know the hang-ups of ICIs.

    Recently, on the AJR Podcast episode “Chest CT Findings of Immune Checkpoint Inhibitor Therapy-Related Adverse Events,” Kerem Ozturk, MD, discussed why awareness of early chest CT findings is required for early detection and accurate diagnosis of ICI therapy-related adverse events [2]. Said events are myriad, including pneumonitis, new consolidation, worsening thoracic tumor burden, pleural/pericardial effusion, and pulmonary emboli in the emergency department.

    We need to know about combinations, too. Promising results have been published in KSR’s own Korean Journal of Radiology regarding ICI combination therapy and ICI combined with radiotherapy. Specifically, as Kim et al. pointed out in their systematic review and meta-analysis, ICI combination therapy or ICI combined with radiotherapy can work wonders, showing better localized efficacy than ICI monotherapy for treating melanoma brain metastasis [3]. Inevitably, the ever-increasing adoption of ICIs will lead to more and more practical applications.

    HCC: Mimics and Machine Learning

    Due to its distinct imaging, HCC can be diagnosed noninvasively, typically via multiphasic CT and MRI. As Yoon et al. reminded us in their survey and pictorial review for the Journal of the Korean Society of Radiology, while imaging features like arterial phase hyperenhancement and washout on portal or delayed phase images is classic for HCC, the ability to distinguish HCC-mimicking lesions (e.g., arterioportal shunts, combined HCC-cholangiocarcinoma, intrahepatic cholangiocarcinoma, hemangioma, etc.) on initial imaging examinations is critical for management and treatment alike [4].

    Radiologists of tomorrow will need to recognize more than just mimics. We must become familiar with multiple machine learning models, as applied to presently underutilized imaging features that could help construct more reliable criteria for organ allocation and liver transplant eligibility. Apropos, recent findings suggest that machine learning-based models can predict recurrence before therapy allocation in patients with early-stage HCC initially eligible for liver transplant.  

    As described in AJR OnTrend, 120 patients diagnosed with early-stage HCC, who were initially eligible for liver transplant and underwent treatment by transplant, resection, or thermal ablation, underwent pretreatment MRI and post-treatment imaging surveillance. Imaging features were extracted from postcontrast phases of pretreatment MRI examinations using a pretrained convolutional neural network. Pretreatment clinical characteristics (including labs) and extracted imaging features were integrated for recurrence prediction to develop three ML models: clinical, imaging, combined. Ultimately, all three models predicted posttreatment recurrence for early-stage HCC from pretreatment clinical, MRI, and both data combined [5]. 

    Paradigm and Response Changes

    Fortunately, the many recent advances in oncologic patient care are allowing physicians to move beyond nonselective cytotoxic therapies. Increasingly, our specialty will come to rely upon more targeted and personalized treatments for cancer: immunotherapies, stereotactic radiation, image-guided interventions, and theranostics. Alongside these novel approaches to cancer treatment, all houses of radiology will need to prop the door open for our specialty to evolve beyond tumor size measurement—recognizing the cumulative variability in the appearance of treatment responses and associated treatment toxicities by CT, MRI, PET, and a host of hybrid imaging. Given the proliferation of still evolving precision treatment pathways, abdominal, gastrointestinal, and genitourinary subspecialists must stay vigilant and informed. “Changing Paradigms in Tumor Response Assessment” aims to provide precisely that—a contemporary, rigorous update regarding the changing appearances of tumor response on multiple modalities and across a wide spectrum of tumors. I cordially invite you to join Jin-Young Choi, Joon-Il Choi, Natally Horvat, Katherine Krajewski, Jeong Min Lee, Sanghyeok Lim, Don Yoo, and me for the 2023 ARRS Global Exchange Featuring Korean Society of Radiology (대한방사선학회).

    References

    1. 2017 KSR-ARRS Global Partnership Breast Imaging Web Symposium. ARRS website. ARRS.org/ARRSLIVE/KSR_BR17/Home/ARRSLIVE/GlobalPartners/Symposia/KSR/BR17/Home.aspx. Accessed September 27, 2022
    2. Ozturk K. Findings on Chest CT Performed in the Emergency Department in Patients Receiving Immune Checkpoint Inhibitor Therapy: Single-Institution 8-Year Experience in 136 Patients. AJR Podcast website. AJRPodcast.libsyn.com/chest-ct-findings-of-immune-checkpoint-inhibitor-therapy-related-adverse-events. Published January 14, 2021. Accessed September 27, 2022
    3. Kim PH et al. Immune checkpoint inhibitor with or without radiotherapy in melanoma patients with brain metastases: a systematic review and meta-Analysis. J Korean Soc Radiol 2022; 83:808–829
    4. Yoon J et al. Atypical manifestation of primary hepatocellular carcinoma and hepatic malignancy mimicking lesions. Korean J Radiol 2021; 22:584–595
    5. Young LK. Machine Learning Models Predict Hepatocellular Carcinoma Treatment Response. ARRS website. ARRS.org/ARRSLIVE/Pressroom/PressReleases/Machine_Learning_Hepatocellular_Carcinoma_Treatment.aspx. Published August 17, 2022. Accessed September 27, 2022
  • Multimodality Breast Imaging and Biopsy—Updates for Your Practice

    Multimodality Breast Imaging and Biopsy—Updates for Your Practice

    Published November 4, 2022

    avatar

    Stamatia V. Destounis, MD, FACR, FSBI, FAIUM

    Managing Partner
    Elizabeth Wende Breast Care

    On Friday, December 9, the final ARRS Virtual Symposium for 2022, Update on Breast Imaging and Multimodality Biopsy, will address timely topics, including digital breast tomosynthesis (DBT), breast ultrasound (US), breast MRI, molecular breast imaging (MBI), and contrast-enhanced mammography (CEM). Didactic lectures will emphasize the most appropriate biopsy methods and procedures for every one of these aforementioned breast imaging modalities—allowing multiple opportunities for radiologists to improve patient outcomes, using current technologies available for early detection of breast cancer.

    Digital Breast Tomosynthesis

    I will begin the presentation at noon, Eastern Time, on December 9. Focusing on clinical implementation of DBT, I will review DBT technology and important factors to consider for practical application, such as improved breast cancer detection, synthetic digital mammography, and workflow for screening and diagnostic populations.

    Recognizing the need for DBT-guided breast biopsy, Sarah M. Friedewald, MD, of Northwestern University will present on advantages and disadvantages of prone and upright biopsy systems, as well as interpretive outcomes for biopsy-proven, DBT-only findings. Earlier this summer in AJR [1], Dr. Friedewald coauthored the first study of its kind comparing pathologic outcomes between patients with single and multiple architectural distortion visualized by DBT. Ultimately, for those patients with multiple architectural distortions identified on DBT, biopsy of all areas may be warranted, given the variation of pathologic diagnoses.

    Breast Ultrasound

    Liane Philpotts, MD, of the Yale School of Medicine will describe how to optimize breast US in symptomatic patients, pointing out tools to enhance correlations between sonographic, mammographic, and DBT findings. Additionally, Dr. Philpotts will describe methods for reducing false positives (false negatives, too). Meanwhile, 2004 ARRS Scholar Jessica W. T. Leung, MD, of MD Anderson Cancer Center [2] will help us define the clinical indications, benefits, and limitations of US-guided procedures of the breast, while assessing the post-biopsy imaging/pathologic concordance.

    Breast MRI

    As recent clinical perspectives have affirmed [3], MRI remains the most sensitive tool for detecting breast cancer; however, cost and acquisition time continue to be deterrents in adopting the technology for routine screening purposes. Following our first question and answer session of the afternoon, fellow InPractice breast imaging contributor [4] Linda Moy, MD, of NYU Langone Health will discuss the present role of screening breast MRI, alongside the roles that AI is poised to play in the very near future. Dr. Moy will also bring everyone up to speed on abbreviated or “ultrafast” MRI protocols for supplemental screening [5]. For her session, Laurie R. Margolies, MD, of Mount Sinai will detail the equipment and techniques required to perform MRI-guided breast biopsy procedures, pointing out both pearls and pitfalls to improve the overall patient experience.

    Molecular Breast Imaging and Contrast-Enhanced Mammography

    Increasingly, MBI continues its integration into routine breast imaging practice. Haydee Ojeda-Fournier, MD, from University of California San Diego Health will present on this topic, describing the variety of MBI indications for use in clinical practice. Her lecture will incorporate discussions of the MBI lexicon, which is well-timed given that, as AJR acknowledged in July [6], we shouldn’t have to wait too much longer for the American College of Radiology’s BI-RADS committee to initiate its own incorporation of MBI lexicon into the BI-RADS Atlas. Finally, Janice S. Sung, MD, of Memorial Sloan Kettering Cancer Center will deliver a must-see session regarding a relatively new breast imaging modality that is quickly gaining acceptance: CEM [7]. CEM renders density and morphologic information on low-energy images in conjunction with physiologic enhancement via the recombined (i.e., subtracted and processed) images. CEM-guided biopsy is not only FDA-approved, as noted in the most recent issue of InPractice [8], it is frequently necessary for proper patient management. Dr. Sung will detail real-world considerations for setting up a CEM program at your institution and practice, followed by another high-impact question and answer session with the entire faculty.

    The experts above continue to enjoy an extensive range of clinical experience with each breast imaging modality presently impacting patient care, so I urge diagnostic radiologists, full-time, or even part-time breast imagers—academic and private practice alike—to join us for Update on Breast Imaging and Multimodality Biopsy on the 9th of December. Offering 4 CME credit hours for ARRS members, the entire program will remain available on demand for practicing radiologists, as well as fellows, residents, and allied medical students, who are unable to attend our live event.  

    References

    1. Wang LC, Philip M, Bhole S, et al. Pathologic outcomes in single versus multiple areas of architectural distortion on digital breast tomosynthesis. AJR 2022; 1–13:10.2214/AJR.22.27625
    2. Scholarship Recipients: Record of ARRS Scholars. ARRS website. ARRS.org/ARRSLIVE/ScholarshipRecipients. Updated February 9, 2022. Accessed October 29, 2022
    3. Marshall H, Pham R, Sieck L, Plecha D. Implementing abbreviated MRI screening into a breast imaging practice. AJR 2019; 213: 234–237
    4. Moy L. Breast Imaging: One Size Does Not Fit All. ARRS InPractice site. www.radfyi.org/breast-imaging-one-size-does-not-fit-all. Published June 22, 2020. Accessed October 29, 2022
    5. Mango VL, Grimm LJ, Harvey JA, Plecha DM, Conant EF. Abbreviated Breast MRI for Supplemental Screening: The Why and How of Clinical Implementation. ARRS InPractice site. www.radfyi.org/abbreviated-breast-mri-supplemental-screening. Published May 13, 2022. Accessed October 29, 2022
    6. Hunt KN, Conners AL, Samreen N, Rhodes DJ, Johnson MP, Hruska CB. PPV of the molecular breast imaging lexicon. AJR 2022; 1–9:10.2214/AJR.21.27047
    7. Gandhi J, Phillips J. Contrast-Enhanced Mammography: Current Applications and Future Directions. ARRS InPractice site. www.radfyi.org/contrast-enhanced-mammography-current-applications-and-future-directions. Published March 1, 2022. Accessed October 29, 2022
    8. Weaver, O. Moving Forward With Contrast-Enhanced Mammography. ARRS InPractice site. www.radfyi.org/moving-forward-with-contrast-enhanced-mammography. Published March 1, 2022. Accessed October 29, 2022
  • Three Challenging Cases in Ankle Imaging: How to Make the Diagnosis

    Three Challenging Cases in Ankle Imaging: How to Make the Diagnosis

    Published November 4, 2022

    avatar

    Sameer Mittu, MBBS

    Division of Musculoskeletal Imaging and Intervention
    Department of Radiology Massachusetts General Hospital

    avatar

    Joao R.T. Vicentini, MD

    Division of Musculoskeletal Imaging and Intervention
    Department of Radiology Massachusetts General Hospital

    avatar

    Connie Y. Chang, MD

    Division of Musculoskeletal Imaging and Intervention
    Department of Radiology Massachusetts General Hospital

    The ankle and foot are challenging areas to image and diagnose, due to complex anatomy. In advance of the 2023 ARRS Annual Meeting Categorical Course, “Pitfalls and Challenging Cases: How to Triumph and Make the Diagnosis,” our InPractice article is a collection of cases that we hope will help you conquer some of these pathologies.

    Nearly all ankle and midfoot cases begin with radiographs, because radiography is the modality we usually encounter initially, and x-rays can often give us many clues about the diagnosis, especially in the ankle. In the midfoot, which has more complicated anatomy, cross-sectional imaging, especially MRI, is often required to make the diagnosis.

    Case No. 1

    For the classic inversion injury or ankle “sprain,” we typically think of lateral ankle ligament injuries, or a fibular avulsion fracture. Since the foot and ankle are relatively flexible, injuries can occur in many places. Our first case is a 27-year-old man who injured his ankle in a rollover car accident. In the lateral aspect of the talar dome—left image above—there is a curvilinear subchondral lucency (dotted curve) seen on the frontal radiographic view, compatible with an osteochondral lesion (arrow).

    Osteochondral lesions (OCL) of the talus can be quite difficult to see on x-rays, and OCLs are often missed, especially when they occur with other bony injuries. For example, a patient may have a fibular fracture, which is adequately treated, and then experience persistent pain later on [1]. If the mechanism of injury involves shearing (e.g., tibiotalar subluxation), compression (e.g., falling from a height) or avulsion (e.g., distraction of the tibiotalar joint), the index of suspicion for an osteochondral injury should be higher, although these details may be difficult to ascertain from the patient or the medical record [2]. Impaction of the talus on the distal tibial plafond leads to microfractures in the cartilage and subchondral bone plate, and the increased pressure from weight-bearing can cause osteonecrosis [3]. This process can take a variable amount of time; therefore, presentation may be delayed up to 6–12 months. Even if the OCL is seen on radiographs, cross-sectional imaging is frequently needed. CT may be more helpful to evaluate small or comminuted OCLs, as ossific fragments may be difficult to visualize on MRI [4]. Apropos, the coronal reconstruction CT image of this case—right image above—demonstrates the mildly displaced, dominant osteochondral fragment (solid arrow). There is an additional punctate ossific fragment (dashed arrow) along the lateral aspect of the osteochondral injury, not seen on the x-ray. It would be unlikely to see this fragment on MRI, simply because of the inadequate spatial resolution.

    Case No. 2

    When an ossific fragment is not displaced, as in this case of a 39-year-old who twisted her ankle on the stairs 6 months ago, MRI can be helpful to evaluate for stability. On the coronal T2 fat-suppressed image—left image above—we can see that the fragment is somewhat irregular at the articular surface, but there is fluid signal intensity completely undercutting the fragment (solid arrow), and bone marrow edema in the adjacent talus, suggesting that the fragment is unstable [5]. There is mild subchondral bony irregularity and depression (dashed arrow), too. Other signs of instability may be cystic change or partial or complete separation of the fragment from the donor site [8].

    The sagittal T1 image—right image above—shows that a large portion of the fragment is low in signal intensity, which persists on all sequences, and there is articular surface collapse, suggesting that the portion is at least partially osteonecrotic [8]. Another portion still demonstrates fat signal intensity (solid arrow) on T1 and high signal on the T2 fat-suppressed image, suggesting that tis portion remains viable.

    This patient was placed on a trial of conservative treatment, including a lace-up ankle brace and semi-rigid orthosis, which had just begun at the time of writing this article. Management depends on patient symptoms, as well as size and stability of the OCL. In general, small (< 15mm2), stable fragments in ankle fractures are treated conservatively, whereas large, unstable fragments are managed operatively [3, 6–7, 9]. Surgical options include arthroscopic drilling, excision and debridement, or osteocartilaginous grafting [2].

    Case No. 3

    Our third and final case is a 33-year-old woman, playing tennis two hours prior to presentation, who had planted her foot, tried to run forward, then felt something like “a hit behind her ankle.” The patient could no longer walk without significant pain. The initial radiograph demonstrates distal Achilles thickening, and more proximally, a focally irregular anterior margin, consistent with Achilles tendinopathy and tear. Achilles tendon ruptures account for 20% of all large tendon ruptures [10]. Showing bimodal age distribution, the first peak occurs around the third to the fifth decade of life, due to high-energy injuries, while the second peak occurs in the elderly, due to low-energy injuries to a degenerated tendon. Men are more commonly affected. Achilles tears are more common in sports with forceful and repetitive jumping or “push-off,” often seen in cyclists, gymnasts, runners, and divers, as well as tennis, basketball, and volleyball players. Risk factors include poor conditioning before exercise, prolonged use of corticosteroids, fluoroquinolone antibiotics, and overexertion [11].  

    Because the Achilles tendon is bound by the Kager fat pad anteriorly and subcutaneous fat posteriorly, an abnormal appearance can often be detected on radiographs [12]. The lateral radiograph—left image above—demonstrates diffuse fusiform thickening of the Achilles tendon (dashed arrow). More proximally, the tendon is irregular anteriorly, consistent with a tear. There is edema in the Kager fat pad (“K”), also indicating acute tear. It can be difficult to determine partial versus full-thickness tear, and in this case, the posterior margin of the tendon appears intact, suggesting that it is a high-grade partial, rather than full-thickness tear, although MRI later confirmed that it was a full-thickness tear. Ossific foci, if present, suggest chronic tears (not seen in this case) [13].

    On MRI, we first observe that the foot was placed in plantar flexion, which may underestimate the tendon gap. While this typically does not preclude diagnosis of the tendon tear, it inevitably brings torn pieces of tendon closer together, and the maximum tendon gap cannot be determined.

    The sagittal T2 fat-suppressed image—right image above—demonstrates a full-thickness tear (“X”) and severely degenerated proximal (dashed arrow) and distal (solid arrows) tendon. The uniformly thickened and hyperintense distal tendon is probably a combination of chronic tendon degeneration and acute edema from the tear, especially as individual fibers within the tendon are relatively well seen. It is important to comment on tendon quality and the length of tendon, which appears severely degenerated, because this tendon may not be useable for repair [14]. Many of the internal strands appear wavy, compatible with retraction. MRI is considered the gold standard for imaging Achilles tendon tears (sensitivity, 80–100%; specificity, 100%) (8, 15). Ultrasound also has high sensitivity (full thickness, 95%; partial thickness, 94%) and specificity (full thickness, 99%; partial thickness, 97%) for the detection of Achilles tendon tears, given the tendon’s superficial location and possibility of dynamic imaging with the modality (16, 17). This patient’s tear was also well seen on ultrasound (not shown).

    Since the patient was only visiting the United States, she was placed in a boot for her trip home, although surgical intervention was required soon after arriving. Management of Achilles tendon ruptures is controversial and evolving. Overall, there has been a general trend moving toward immobilization with functional rehabilitation, rather than treating all ruptures exclusively with surgical repair [18, 19].

    Focusing on interpretative skills for avoiding misdiagnoses across a wide spectrum of musculoskeletal imaging pitfalls, the 2023 ARRS Annual Meeting Categorical Course, “Pitfalls and Challenging Cases: How to Triumph and Make the Diagnosis,” will also tackle challenging cases within neuroradiology, abdominal, and chest imaging. Topics will emphasize real-life clinical scenarios, while providing tips and tricks for optimal performance. We invite you to join us on the beautiful island of Oahu in Honolulu, HI (or virtually or even on demand) for this exciting, 18-hour Categorical Course, purposefully designed to enhance your ability to add value to patient management.

    References

    1. StatPearls Publishing; www.ncbi.nlm.nih.gov/books/NBK556139. Cited Accessed Aug 18 2022
    2. Badekas T, Takvorian M, Souras N. Treatment principles for osteochondral lesions in foot and ankle. Int Orthop 2013; 37:1697–706
    3. Rikken QGH, Kerkhoffs GMMJ. Osteochondral lesions of the talus: an individualized treatment paradigm from the Amsterdam perspective. Foot Ankle Clin 2021; 26:121–36
    4. Yasui Y, Hannon CP, Fraser EJ, et al. Lesion size measured on MRI does not accurately reflect arthroscopic measurement in talar osteochondral lesions. Orthop J Sports Med 2019; 7:2325967118825261
    5. Rios AM, Rosenberg ZS, Bencardino JT, Perez Rodrigo S, Garcia Theran S. Bone marrow edema patterns in the ankle and hindfoot: distinguishing MRI features. AJR 2011; 197:720–729
    6. Pedersen ME, DaCambra MP, Jibri Z, Dhillon S, Jen H, Jomha NM. Acute osteochondral fractures in the lower extremities–approach to identification and treatment. Open Orthop J 2015; 9:463–474
    7. Gianakos AL, Yasui Y, Hannon CP, Kennedy JG. Current management of talar osteochondral lesions. World J Orthop 2017; 8:12–20
    8. Szaro P, Geijer M, Solidakis N. Traumatic and non-traumatic bone marrow edema in ankle MRI: a pictorial essay. Insights Imaging 2020; 11:97
    9. van Dijk CN, Reilingh ML, Zengerink M, van Bergen CJA. Osteochondral defects in the ankle: why painful? Knee Surg Sports Traumatol Arthrosc 2010; 18:570–580
    10. Gross CE, Nunley JA. Acute Achilles tendon ruptures. Foot Ankle Int 2016; 37:233–239
    11. Shamrock AG, Varacallo M. Achilles tendon rupture. StatPearls [Internet]. Treasure Island (FL): StatPearls Publishing; www.ncbi.nlm.nih.gov/books/NBK430844. Cited Accessed Aug 18 2022
    12. Theobald P, Bydder G, Dent C, Nokes L, Pugh N, Benjamin M. The functional anatomy of Kager’s fat pad in relation to retrocalcaneal problems and other hindfoot disorders. J Ana 2006; 208:91
    13. Paoloni J. Tendon injuries–practice tips for GPs. Aust Fam Physician 2013; 42:176–180
    14. Bäcker HC, Wong TT, Vosseller JT. MRI assessment of degeneration of the tendon in Achilles tendon ruptures. Foot Ankle Int 2019; 40:895–899
    15. Dams OC, Reininga IHF, Gielen JL, van den Akker-Scheek I, Zwerver J. Imaging modalities in the diagnosis and monitoring of Achilles tendon ruptures: a systematic review. Injury 2017; 48:2383–2399
    16. Chang A, Miller TT. Imaging of tendons. Sports Health 2009; 1:293–300
    17. Aminlari A, Stone J, McKee R, et al. Diagnosing Achilles tendon rupture with ultrasound in patients treated surgically: a systematic review and meta-analysis. J Emerg Med 2021; 61:558–567
    18. Park SH, Lee HS, Young KW, Seo SG. Treatment of acute Achilles tendon rupture. Clin Orthop Surg 2020; 12:1–8
    19. Deng S, Sun Z, Zhang C, Chen G, Li J. Surgical treatment versus conservative management for acute Achilles tendon rupture: a systematic review and meta-analysis of randomized controlled trials. J Foot Ankle Surg 2017; 56:1236–1243
  • Pearls and Pitfalls of Peer Learning: Updating Your Own Wish List

    Pearls and Pitfalls of Peer Learning: Updating Your Own Wish List

    Published October 20, 2022

    avatar

    Cindy S. Lee, MD

    Department of Radiology, NYU Langone Health

    Since its introduction nearly 20 years ago, score-based peer review has not been shown to have a meaningful impact on or be an accurate measurement of radiologist performance [1]. A new paradigm—peer learning—has emerged, which is a group activity where practicing professionals review each other’s work, actively give and receive feedback in a constructive manner, teach and learn from one another, and mutually commit to improving performance as individuals and as a group. As my colleague, coauthor, and present chair of ARRS’ Professional & Performance Improvement Committee, Nadja Kadom, MD, first noted here in the pages of InPractice back in 2019, peer learning is “a system that uses accuracy of interpretation as a surrogate marker for competency” [2].

    Many radiology practices are beginning to transition from score-based peer review to peer learning, but these same practices face distinct challenges and multiple barriers to implementation, especially considering the variety of leadership styles Dr. Kadom has recently detailed [3]. Case in point: nearly half of the 742 members of ARRS who participated in our 2020 AJR Original Research article, “Current Status and Future Wish List of Peer Review: A National Questionnaire of U.S. Radiologists,” reported insufficient learning outcomes from peer review [4]. Clarifying a minimum number of cases that required monthly review, as well as how interpretive discrepancies would be communicated, were two big factors where some level of standardization was clearly needed.

    Perhaps most importantly, the demographics of our survey respondents reflected the current composition of this country’s imaging workforce. A total 742 (4.2% response rate) ARRS members replied to our 21-question, multiple-choice questionnaire. Among those respondents, 547 (73.7%) were board-certified, practicing radiologists also participating in a form of peer review. As you can see, most responders were in private practice (51.7%, 283/547), while the next largest cohort was in academic practice (32.4%). The most common practice size was 11–50 radiologists (50.5%), followed by groups of up to 10 radiologists (21.2%). The majority of responders practiced in urban settings (61.6%), too.

    Practice CharacteristicNo. (%)
    Type 
    Private283 (51.7)
    Academica177 (32.4)
    Hybridb45 (8.2)
    Government42 (7.7)
    No. of radiologists 
    0–10116 (21.2)
    11–50276 (50.5)
    51–10085 (15.5)
    >10070 (12.8)
    Setting 
    Urban337 (61.6)
    Suburban158 (28.9)
    Rural52 (9.5)
    aAcademic practices had medical school and radiology residency program.
    bHybrid practices had radiology residency program without a medical school.

    Nonetheless, in this largest nationwide questionnaire to imaging professionals regarding the present state of and their future needs for peer review, most radiologists working in the United States felt a better system is not only necessary, but that said system could even be feasible in daily practice.

    To our knowledge, “Updates for Your Peer Learning Activities: Pitfalls, Tips, and Accreditations” remains the only course of its kind. Presented live as a Featured Sunday Session during the 2023 ARRS Annual Meeting in Honolulu, HI, this course is now in its second revised and expanded iteration, packed with practical tips to clinical success, all taught by experts in the field. Summarizing the current status and practice gap in peer review in radiology, sessions will include three didactic lectures to showcase the best practices and challenges of peer learning programs at multiple institutions, including Emory, NYU, Stanford and Mayo Clinic. Esteemed faculty will highlight potential barriers to starting and sustaining peer learning activities in both academic and private practice settings, each instructor sharing their own “top 5 tips” for overcome these challenges. We will also address the latest updates from the American College of Radiology’s Quality and Safety Commission regarding new accreditation pathways for peer learning [5].

    The evolution of peer learning is of universal importance for the continuing education of all radiologists—in practice, during fellowship or residency. However, the intersecting concepts of peer learning, just culture, etc. are evolving at a breakneck pace, with brand-new accreditation pathways opening up and multiple acceptable approaches to finding the “right answer” [6]. For imaging professionals already involved in peer learning, come share your experience with our expert panel, ensuring you are getting the most out of your program. For those new to peer learning, come learn how to fish for the pearls, avoid the pitfalls, and hit the ground running. We will conclude with an interactive panel discussion with the audience—there in Hawaii, virtually, or on demand.

    References

    1. Larson DB et al. Transitioning from peer review to peer learning: report of the 2020 Peer Learning Summit. J Am Coll Radiol 2020; 17:1499–1508
    2. Kadom N, Lee C. Moving from Peer Review to Peer Learning. ARRS InPractice website. www.radfyi.org/moving-from-peer-review-to-peer-learning. Published Fall 2019. Accessed October 3, 2022
    3. Kadom N. Anything Goes—Is It True for Leadership Styles? RadTeams.org/2022/09/26/leadership-styles-radiology-teams. Published September Accessed September 10, 2022
    4. Lee CS. Current status and future wish list of peer review: a national questionnaire of U.S. radiologists. AJR 2020; 214:493–497
    5. ACR Commission on Quality and Safety. ACR website. www.acr.org/Member-Resources/Commissions-Committees/Quality-Safety. Updated August 29, 2022. Accessed October 3, 2022
    6. Woodcock R. How to Do Peer Review in Radiology. Diagnostic Imaging website. www.diagnosticimaging.com/view/how-do-peer-review-radiology. Published February 4, 2014. Accessed October 3, 2022
  • Moving Forward With Contrast-Enhanced Mammography

    Moving Forward With Contrast-Enhanced Mammography

    Published October 12, 2022

    avatar

    Olena Weaver, MD

    @OWeaverMD
    Department of Breast Imaging,
    Division of Diagnostic Imaging
    MD Anderson Cancer Center

    Contrast-enhanced mammography (CEM) is a relatively new modality which is rapidly gaining acceptance in breast imaging. Many medical centers have already acquired the necessary equipment to implement CEM programs [1], thus creating an ever-increasing demand for trusted CEM educational resources.

    At the same time, however, there remains a paucity of quality instructional materials for this emerging tool, a lack of structured, case-based training, and fundamental misconceptions regarding both the technical aspects and the operational/administrative knowledge needed for successful implementation of CEM.

    On day one of the 2023 ARRS Annual Meeting, Sunday, April 16, live (and virtually, of course) from Honolulu on the enchanting island of Oahu, HI, Drs. Wendie Berg, Bhavika Patel, and I, will offer a two-hour introductory program on practical CEM for radiologists. Our Featured Sunday Session, “Contrast-Enhanced Mammography: The Essentials and Beyond,” will include interactive didactic and case-based lectures to educate and update practicing radiologists on the important foundational principles of CEM. The course will be supplemented with an optional short pre- and post-test survey to help the audience organize the information and evaluate their learning progress.

    CEM Augments Mammography Capabilities in the Digital Era

    The strength of CEM is its ability to provide both morphologic information on low-energy images, similar to a standard 2D mammogram, and functional information of contrast distribution on the “recombined” (subtracted and processed) images. This is achieved by software and hardware modifications to modern mammographic equipment and necessitates patient workflow adjustments in breast centers [2]. The course will present the basics of CEM technology, its strengths and limitations, as well as helpful tips on implementing this modality in clinical practice.  

    Additionally, the course will serve as a guide to CEM image interpretation with a special emphasis on utilization of the newly introduced Breast Imaging Reporting & Data System (BI-RADS®) CEM lexicon [3].

    We will also discuss background parenchymal enhancement (BPE) in CEM image interpretation. Similar to breast tissue density of mammography, increased BPE may both mask and mimic cancer on CEM. As on MRI, there are four categories of BPE (Fig. 1), and multiple factors are associated with increased BPE [4]. We will present the audience with a range of appearances for normal BPE on CEM.

    Drs. Berg, Patel, and myself will provide a case-based introduction to the most common artifacts and cancer mimics on CEM, too. This topic is continuously evolving. In the July issue of AJR, enhancing cherry hemangioma has been described as a common benign finding that may be misleading (Fig. 2) [5]. It is helpful for the technologist to make note of skin lesions, which can be marked to facilitate recognition.

    CEM Screening and Diagnostic Applications

    Chief among the topics discussed will be the role of CEM, alongside other legacy modalities, in today’s screening and diagnostic guidelines and society-endorsed consensus recommendations for breast cancer imaging. CEM is already recommended as an alternative to MRI in screening of women at high risk of breast cancer and in average-risk women with dense breasts [6]. An AJR article from 2021 demonstrated that CEM shows promise as a breast cancer screening examination in patients with a personal history of lobular neoplasia [7].  

    Of clinical importance is the fact that enhancing CEM-detected lesions that have an ultrasound correlate are more likely to be malignant. These data were also published by AJR in 2021 [8]. Among 153 enhancing lesions detected on CEM in 144 patients, the authors found ultrasound correlates in 47 (31%). Furthermore, this means that a substantial number of enhancing findings can potentially be sampled with ultrasound-guided biopsy (Fig. 3).

    Diagnostic applications of CEM in breast imaging continue to evolve. In the July issue of AJR, CEM was compared with MRI for neoadjuvant therapy (NAT) response assessment [9, 10]. After NAT for breast cancer, CEM and MRI yielded similar assessments of lesion size (both slightly overestimated vs. pathology) and RECIST categories, and no significant difference in specificity for complete pathologic response. Duly noting that MRI had higher sensitivity for complete pathologic response, Bernardi et al. showed preliminary data suggesting that a delayed CEM acquisition 6 minutes after contrast injection could help detect residual ductal carcinoma in situ (DCIS) [10]. The authors concluded that while MRI remains the preferred test for NAT monitoring, the findings support CEM as a useful alternative when MRI is contraindicated or not tolerated [10, 11].

    CEM may be a useful alternative to MRI in women with newly diagnosed breast cancer and breast augmentation. The findings of Carnahan et al. published in AJR last year suggest the plausibility of CEM for disease extent assessment in women with breast augmentation and contraindication or limited access to MRI [12].

     The study evaluated 17 female breast cancer patients with breast implant augmentation, who underwent both CEM and MRI for staging. CEM and MRI were concordant for the index cancer in all 17 women. Six additional lesions were demonstrated by CEM and confirmed by MRI in 6 (35%) women: three multifocal, one multicentric, and two contralateral; two (33%) were malignant (one each invasive ductal and invasive lobular carcinoma). MRI did not identify any additional cancers not seen on CEM.

    CEM-Guided Biopsy

    Perhaps the largest unmet need for expertly curated CEM education surrounds CEM-guided biopsy. Case in point: recently FDA-approved—but not yet widely available—direct CEM-guided biopsy is often a necessary step in patient management. In the absence of CEM-guided biopsy capability, suspicious enhancing findings that have no definite correlate on low energy images, tomosynthesis, or ultrasound require possible MRI-guided biopsy for diagnosis. This increases cost and prolongs diagnostic workup. With the introduction of CEM-guided biopsy technology, this workflow is expected to become more streamlined and efficient.  Our subspecialized presenters have personal experience with this technology and will deliver a comprehensive overview of the current state of knowledge and the future directions of CEM-guided biopsies.   

    CEM Essentials—and Beyond—at the ARRS Annual Meeting

    Contemporary breast imagers must become more familiar with the range of indications and contraindications on CEM, such as normal variants, BPE, pathology, and artifacts. Focused sessions will also address interpretative skills in CEM—including appropriate use of the recently released BI-RADS CEM lexicon from the American College of Radiology—giving radiologists in private and academic practices alike applied insights from real-life cases.

    Although the target audience for our course is predominantly medical imaging professionals considering or actively implementing CEM in practice, the curriculum presented live on Sunday, April 16 will also be relevant and valuable for recent residency or fellowship graduates, particularly those transitioning to imaging practices with established CEM services.

    As the field moves forward, medical centers with established CEM programs will inevitably need to educate an incoming imaging workforce and new trainees who have not experienced enough clinical exposure to this modality in their previous practices or training programs. Apropos, “Contrast-Enhanced Mammography: The Essentials and Beyond” will also offer participants a unique opportunity to test and evaluate a newly developed online teaching module for CEM, purposefully designed to train the radiologists of today and tomorrow in clinical implementation of CEM in their own practices.

    References

    1. Gandhi J, Phillips J. Contrast-Enhanced Mammography: Current Applications and Future Directions. ARRS InPractice website. www.radfyi.org/contrast-enhanced-mammography-current-applications-and-future-directions. Published March 1, 2022. Accessed September 12, 2022
    2. Perry H, Phillips J, Dialani V, Slanetz PJ, Fein-Zachary VJ, Karimova EJ, et al. Contrast-Enhanced Mammography: A Systematic Guide to Interpretation and Reporting. AJR 2019; 212:222–223
    3. Breast Imaging Reporting & Data System (BI-RADS®) Contrast Enhanced Mammography (CEM) Supplement. ACR website. www.acr.org/-/media/ACR/Files/RADS/BI-RADS/BIRADS_CEM_2022.pdf. Published 2022. Accessed September 12, 2022
    4. Karimi Z, Phillips J, Slanetz P, Lotfi P, Dialani V, Karimova J, et al. Factors Associated With Background Parenchymal Enhancement on Contrast-Enhanced Mammography. AJR 2020; 216:340–348
    5. Lu AH, Zuley ML, Berg WA. Enhancing Cherry Hemangioma: A Mimic for Breast Cancer on Contrast-Enhanced Mammography. American Journal of Roentgenology. 2022;219(1):160-1.
    6. The ACR Appropriateness Criteria® American College of Radiology Appropriateness Criteria. Supplemental Breast Cancer Screening Based on Breast Density. ACR website. acsearch.acr.org/docs/3158166/Narrative. Published 2021. Accessed September 12, 2022.
    7. Hogan MP, Amir T, Sevilimedu V, Sung J, Morris EA, Jochelson MS. Contrast-Enhanced Digital Mammography Screening for Intermediate-Risk Women With a History of Lobular Neoplasia. AJR 2021; 216:1486–1491
    8. Coffey K, Sung J, Comstock C, Askin G, Jochelson MS, Morris EA, et al. Utility of Targeted Ultrasound to Predict Malignancy Among Lesions Detected on Contrast-Enhanced Digital Mammography. AJR 2021; 217:595–604
    9. Woodard S. Editorial comment: evidence supporting contrast-enhanced mammography (CEM) for monitoring neoadjuvant chemotherapy response and showing the potential of delayed CEM. AJR 2022;11
    10. Bernardi D. et al. Contrast-enhanced mammography versus MRI in the evaluation of neoadjuvant therapy response in patients with breast cancer: a prospective study. AJR 2022; 14:1–11
    11. Alabousi M. Role of Contrast-Enhanced Mammography in Breast Cancer Neoadjuvant Therapy Response. AJR podcast website. AJRpodcast.libsyn.com/role-of-contrast-enhanced-mammography-in-breast-cancer-neoadjuvant-therapy-response. Published August 10, 2022. Accessed September 12, 2022
    12. Carnahan MB et al. Contrast-enhanced mammography for newly diagnosed breast cancer in women with breast augmentation: preliminary findings. AJR 2021; 217:855–856
  • Primary Pediatric Posterior Fossa Tumors: An Illustrative Review

    Primary Pediatric Posterior Fossa Tumors: An Illustrative Review

    Published September 30, 2022

    avatar

    William T. O’Brien, Sr., DO

    Division of Pediatric Neuroradiology
    Orlando Health—Arnold Palmer Hospital for Children

    avatar

    Avery Wright, DO

    Division of Pediatric Neuro-Oncology
    Orlando Health—Arnold Palmer Hospital for Children

    avatar

    Mohit Agarwal, MD

    Division of Neuroradiology
    Medical College of Wisconsin

    avatar

    Lily Wang, MBBS, MPH

    Division of Neuroradiology
    University of Cincinnati Medical Center

    avatar

    Karen L. Salzman, MD

    Division of Neuroradiology
    University of Utah Medical Center

    Primary brain tumors are the most common solid tumors in children, second only to leukemia in terms of cancer incidence, and are the leading cause of childhood cancer-related mortality [1, 2]. Tumors may present across all pediatric age groups, including infants, children, adolescents, and young adults, with the majority of cases presenting in the first decade of life. Clinical presentations vary, based upon the type of tumor, location, and patient age; however, the most common presenting symptoms include headaches, nausea and vomiting, and gait abnormalities [3]. In infants and very young children, obstructive hydrocephalus results in macrocephaly with bulging fontanelle [4]. Brainstem tumors commonly have symptoms associated with involved tracts and cranial nerves.

    Imaging plays a crucial role in the initial workup, management, and post-treatment follow-up of primary pediatric posterior fossa tumors. Treatment options vary, based upon the tumor type, location, and patient age, and are beyond the scope of this InPractice review. The most common primary posterior fossa tumors in children that we will discuss and illustrate during our 2023 ARRS Annual Meeting Categorical Course session include (in descending order of frequency): medulloblastoma, pilocytic astrocytoma, ependymoma, diffuse midline glioma, and atypical teratoid-rhabdoid tumor.

    Medulloblastoma

    Medulloblastomas are high-grade (WHO grade 4) embryonal tumors and represent the most common malignant and the most common primary posterior fossa brain tumors in children [5]. Various subcategories of medulloblastomas have been described and used in the past; however, the latest molecular classification lists the following subtypes: wingless/integrated (WNT)—activated, sonic hedgehog (SHH)—activated, and non-WNT/non-SHH (also known as groups 3 and group 4), with additional subcategories for SHH-activated and non-WNT/non-SHH variants [6]. Classically, medulloblastomas were thought of as midline cerebellar tumors, but certain subtypes have a propensity for off-midline presentations.

    General Imaging Features

    Imaging characteristics for the various subtypes of medulloblastoma are overall similar, reflecting that of densely packed, highly cellular tumors. Masses tend to be spherical in shape and displace adjacent structures, as opposed to the more pliable appearance of ependymomas. Increased density on CT and diffusion restriction on MRI are characteristic of medulloblastomas, reflective of their high cellularity. T2 signal intensity is variable, typically having areas of both increased and decreased T2 signal compared to cerebellar parenchyma. Small intralesional cysts are common, while intralesional hemorrhage and calcification are uncommon, though may occasionally be seen. Enhancement ranges from patchy to more robust solid enhancement [7, 8] (Fig. 1).

    On MR spectroscopy, a high-grade tumoral spectrum is evident with increased choline and decreased N-acetyl aspartate peaks. A taurine peak just to the left of the choline peak may be a specific marker for medulloblastoma in the posterior fossa [9].

    The frequency of metastatic disease varies depending upon the molecular subtype, ranging from approximately 10% to up to 45% at the time of initial presentation [5]. It is therefore important to image the spine prior to surgical resection and with subsequent surveillance imaging to evaluate for disseminated disease.

    WNT-Activated Medulloblastoma

    WNT-activated medulloblastomas are the least common subset and have the best overall prognosis. These tumors commonly present in older children and adolescents and may occur midline or laterally around the foramen of Luschka, cerebellar peduncle, and cerebellopontine angle [6, 7, 10].

    SHH-Activated Medulloblastoma

    SHH-activated medulloblastomas are a more heterogeneous subset than WNT-activated, with an overall intermediate prognosis. Tumors tend to be located laterally in the cerebellar hemispheres, since they are thought to arise from precursors in the external granule-cell layer of the cerebellum, but they may occur in the midline as well [6, 11]. There is a bimodal presentation, occurring most commonly in infants and then young adults, though they may also occur in children. The infantile variant tends to have extensive nodularity on histology and more frequently metastasizes [11, 12]. Nearly all nodular or desmoplastic variants fall into this category. SHH-activated medulloblastomas are stratified based on their TP53 status as either TP53-wildtype or TP53-mutant, with TP53-mutant portending a worse prognosis [6].

    Non-WNT/Non-SHH Medulloblastoma, Groups 3 and 4

    Non-WNT/non-SHH medulloblastomas are the most common molecular subsets, have an increased incidence in boys, present as midline vermian tumors, and often have classic or large cell anaplastic features on histology. Group 3 tumors tend to occur in infants and young children, have a higher incidence of metastases, and have the worst overall prognosis of any medulloblastoma tumor subset. Group 4 tumors are the most common subset, occur in older children and adolescents, and have an intermediate prognosis [6, 11]. In terms of distinguishing imaging features, group 3 tumors often have avid enhancement, while hypoenhancement is preferentially seen with group 4 tumors [13].

    Pilocytic Astrocytoma

    Pilocytic astrocytomas are the most common primary brain tumor in children, accounting for approximately one-third of all gliomas, and the second most common primary posterior fossa tumor in children after medulloblastomas. They are low-grade, WHO grade 1, tumors with an excellent prognosis in the setting of gross total surgical resection. Pilocytic astrocytomas result from MAPK pathway alterations, often with BRAF fusion or BRAF V600E point mutations. BRAF fusion is common in posterior fossa pilocytic astrocytomas and is associated with improved outcomes [14]. BRAF V600E point mutations, on the other hand, tend to be associated with poorer outcomes [15]. Increased frequency of pilocytic astrocytomas is seen in patients with neurofibromatosis type 1 (NF1), most commonly involving the optic pathways, though they may occur nearly anywhere with NF1 [16].

    Posterior fossa pilocytic astrocytomas most often arise within the cerebellar hemispheres and are therefore lateral in location. Less commonly, they may be midline, arising from the cerebellar vermis. The classic imaging appearance is a large cystic mass with a peripheral solid nodule. More heterogeneous presentations, including a multicystic mass, predominantly solid mass with central cystic changes, or partially hemorrhagic mass, are less common [7, 17].

    On MRI, the cystic component of the tumor is often similar to CSF signal intensity on T1 and T2 sequences, with the T2-FLAIR signal being more variable, based upon internal proteinaceous content. Solid portions of the mass avidly enhance, and there may also be enhancement along the margins of the cyst wall. A helpful distinguishing feature of a pilocytic astrocytoma, compared to other posterior fossa tumors, is the lack of diffusion restriction within the solid components of the tumor [18, 19] (Fig. 2).

    Ependymoma

    Ependymomas are the third most common primary posterior brain tumors, after medulloblastomas and pilocytic astrocytomas. The majority are classic, WHO grade 2, ependymomas, with more aggressive anaplastic ependymomas being WHO grade 3. Ependymomas are soft, pliable tumors that originate in or near the fourth ventricle and squeeze through the outlet foramina into adjacent spaces and cisterns. Because of their pliability, they often surround or encase neurovascular structures.

    There are two subgroups of posterior fossa ependymomas: posterior fossa group A (PFA) and posterior fossa group B (PFB) [20]. PFA variants occur most often in infants, are lateral in location, and have a relatively poor prognosis. Because of the lateral location and common extension into the prepontine cistern, gross total resection is often difficult, and radiation therapy is typically avoided in infants because of the potential for morbidity. PFB variants occur in older children and adolescents, tend to arise from the floor of the fourth ventricle, and have a better overall prognosis than PFA variants [16, 21].

    On MRI, ependymomas tend to be heterogeneously T2 hyperintense with variable enhancement. Cystic change and calcifications are common, with calcifications occurring in up to 50% of cases, much more common than is seen with medulloblastomas [7]. Given the relative pliability of the tumor, extension through fourth ventricular outlet foramina is characteristic. The presence of reduced or restricted diffusion is variable, but typically less than is seen with highly cellular medulloblastomas. The exception is with anaplastic ependymomas, which may have areas of restricted diffusion that are similar to medulloblastomas. Anaplastic ependymomas tend to have a higher frequency of disseminated metastatic disease and disease recurrence, with a poorer prognosis compared to lower-grade ependymomas [22]. The frequency of disseminated metastatic disease for ependymomas is less than that for medulloblastomas.

    Diffuse Midline Glioma

    Diffuse midline gliomas (DMGs) “H3K27-altered” are highly aggressive pediatric brain tumors (WHO grade 4) that encompass the majority of lesions previously referred to as diffuse intrinsic pontine gliomas (DIPGs). Prognosis is dismal with a median survival of approximately 11 months from diagnosis [23]. Given the brainstem location, the most common clinical presentations include cranial nerve palsies, pyramidal tract signs (paresis, hyperreflexia, or positive Babinski reflex), and cerebellar signs (dysmetria, ataxia, dysarthria, or nystagmus) [23]. DMGs tend to occur in younger children, with median age at presentation around 6 years [24].

    On MR imaging, DMGs present as a diffuse, ill-defined, T2 hyperintense, expansile masses centered within the pons. The degree of enhancement is variable, often absent at initial presentation and typically patchy when present (Fig. 3).

    Peripheral enhancement commonly occurs along margins of central necrosis, which occurs more frequently after radiation therapy [25]. Intralesional hemorrhage is uncommon, but areas of hemosiderin deposition may be seen on susceptibility-weighted sequences. Focal areas of restricted diffusion develop in the majority of cases. The presence of central necrosis, diffusion restriction, or enhancement at the time of initial diagnosis has been shown to portend a worse prognosis [24].

    Extrapontine spread is common throughout the brainstem, into the thalami and adjacent structures, through the cerebellar peduncles, and into the cerebellar hemispheres. Exophytic components engulf the basilar artery anteriorly and efface the fourth ventricle posteriorly. Disseminated metastatic disease is uncommon, though may be seen occasionally.

    Historically, DMGs have been treated presumptively when characteristic imaging features are present, reserving biopsy for cases with nonclassic imaging features or when tissue sampling is required for a clinical trial eligibility. However, more centers are now performing biopsies prior to treatment to confirm molecular classification and histology, shed light on potential prognosis, and help advance investigation of future adjuvant therapies. When biopsy is performed, the posterolateral portion of signal abnormality is typically targeted to minimize potential morbidity. If focal areas of diffusion restriction are present, these areas tend to have the highest diagnostic yield, if they can be safely accessed and sampled [26].

    Atypical Teratoid-Rhabdoid Tumor

    Atypical teratoid-rhabdoid tumors (ATRTs) are rare and highly aggressive (WHO grade 4) embryonal tumors that tend to occur in infants and young children, with the majority of cases presenting under 3 years of age. As with medulloblastomas, posterior fossa ATRTs may be midline or off-midline and are highly cellular with areas of diffusion restriction. Imaging features significantly overlap with medulloblastoma; therefore, patient age is one of the key features in suggesting ATRT versus medulloblastoma. Compared to medulloblastomas, ATRTs tends to have a more heterogeneous imaging appearance, with a higher incidence of intralesional hemorrhage and calcification, as well as a higher incidence of disease dissemination at the time of presentation [27, 28].

    For most cases of primary posterior fossa tumors in children, the correct diagnosis can be suggested based upon distinguishing imaging features, with remaining cases requiring a thoughtful differential diagnosis in the setting of overlapping or nonspecific imaging findings. Our Categorical Course session will focus on recognizing characteristic imaging features for the most common primary pediatric posterior fossa tumors.


    References

            1.     Pollack IF, Agnihotri S, Broniscer A. Childhood brain tumors: current management, biological insights, and future directions. J Neurosurg Pediatr 2019; 23:261–273

            2.     Pollack IF. Brain tumors in children. N Engl J Med 1994; 331:1500–1507

            3.     Prasad KSV, Ravi D, Pallikonda V, Raman BV. Clinicopathological study of pediatric posterior fossa tumors. J Pediatr Neurosci 2017; 12:245–250

            4.     Picariello S, Spennato P, Roth J, et al. Posterior fossa tumours in the first year of life: a two-centre retrospective study. Diagnostics (Basel) 2022; 12:1–12

            5.     Packer RJ, Cogen P, Vezina G, Rorke LB. Medulloblastoma: clinical and biologic aspects. Neuro Oncol 1999; 1:232–250

            6.     Cohen AR. Brain tumors in children. N Engl J Med 2022; 386:1922–1931

            7.     Jaju A, Yeom KW, Ryan ME. MR imaging of pediatric brain tumors. Diagnostics (Basel) 2022; 12:1–24

            8.     Shih RY, Koeller KK. Embryonal tumors of the central nervous system. RadioGraphics 2018; 38:525–541

            9.     Panigrahy A, Krieger MD, Gonzalez-Gomez I, et al. Quantitative short echo time 1H-MR spectroscopy of untreated pediatric brain tumors: preoperative diagnosis and characterization. AJNR 2006; 27:560–572

            10.  Patay Z, DeSain LA, Hwang SN, et al. MR imaging characteristics of wingless-type-subgroup pediatric medulloblastoma. AJNR 2015; 36:2386–2393

            11.  Juraschka K, Taylor MD. Medulloblastoma in the age of molecular subgroups: a review. J Neurosurg Pediatr 2019; 24:353–363

            12.  Cavalli FMG, Remke M, Rampasek L, et al. Intertumoral heterogeneity within medulloblastoma subgroups. Cancer Cell 2017; 31:737–754.e6

            13.  Perreault S, Ramaswamy V, Achrol A, et al. MRI surrogates for molecular subgroups of medulloblastoma. AJNR 2014; 35:1263–1269

            14.  Becker AP, Scapulatempo-Neto C, Carloni AC, et al. KIAA1549: BRAF gene fusion and FGFR1 hotspot mutations are prognostic factors in pilocytic astrocytomas. J Neuropathol Exp Neurol 2015; 74:743–754

            15.  Nobre L, Zapotocky M, Ramaswamy V, et al. Outcomes of BRAF V600E pediatric gliomas treated with targeted BRAF inhibition. JCO Precis Oncol 2020; 4:561–571

            16.  AlRayahi J, Zapotocky M, Ramaswamy V, et al. Pediatric brain tumor genetics: what radiologists need to know. RadioGraphics 2018; 38:2102–2122

            17.  O’Brien WT. Imaging of Primary posterior fossa brain tumors in children. J Am Osteopath Coll Radiol 2013; 2:2–12

            18.  Novak J, Zarinabad N, Rose H, et al. Classifcation of paediatric brain tumours by diffusion weighted imaging and machine learning. Sci Rep 2021; 11:2987

            19.  Koral K, Alford R, Choudhury N, et al. Applicability of apparent diffusion coefficient ratios in preoperative diagnosis of common pediatric cerebellar tumors across two institutions. Neuroradiology 2014; 56:781–788

            20.  Louis DN, Perry A, Wesseling P, et al. The 2021 WHO classification of tumors of the central nervous system: a summary. Neuro Oncol 2021; 23:1231–1251

            21.  Wu J, Armstrong TS, Gilbert MR. Biology and management of ependymomas. Neuro Oncol 2016; 18:902–913

            22.  Yuh EL, Barkovich AJ, Gupta N. Imaging of ependymomas: MRI and CT. Childs Nerv Syst 2009; 25:1203–1213

            23.  Hoffman LM, Veldhuijzen van Zanten SEM, Colditz N, et al. Clinical, radiologic, pathologic, and molecular characteristics of long-term survivors of diffuse intrinsic pontine glioma (DIPG): a collaborative report from the International and European Society for Pediatric Oncology DIPG Registries. J Clin Oncol 2018; 36:1963–1972

            24.  Leach JL, Roebker J, Schafer A, et al. MR imaging features of diffuse intrinsic pontine glioma and relationship to overall survival: Report from the International DIPG Registry. Neuro Oncol 2020; 22:1647–1657

            25.  Aboian MS, Solomon DA, Felton E, et al. Imaging characteristics of pediatric diffuse midline gliomas with histone H3 K27M mutation. AJNR 2017; 38:795–800

            26.  Biery MC, Noll A, Myers C, et al. A protocol for the generation of treatment-naïve biopsy-derived diffuse intrinsic pontine glioma and diffuse midline glioma models. J Exp Neurol 2020; 1:158–167

            27.  Arslanoglu A, Aygun N, Tekhtani D, et al. Imaging findings of CNS atypical teratoid/rhabdoid tumors. AJNR 2004; 25:476–480

            28.  Jin B, Feng XY. MRI features of atypical teratoid/rhabdoid tumors in children. Pediatr Radiol 2013; 43:1001–1008