Volunteers have been foundational to the American Roentgen Ray Society (ARRS), allowing North America’s very first radiological society to ensure its strategic initiatives remain achieved. And to carry out the organizational needs and directives of this society, ARRS members and associate members alike are invited to serve on standing or ad hoc committees furthering our overall mission: improving health through a community committed to advancing the profession of medical imaging and its allied sciences.
Presently, there are ARRS committees expertly focused on professional and practice improvement, scientific innovation, education, membership, and international outreach. The ARRS Professional and Practice Improvement Committee has been charged with overseeing our professional development programs, cultivating leadership opportunities, as well as initiating several practice quality improvements.
Chief among these improvements has been establishing a brand-new ARRS Quality and Practice Improvement Subcommittee–a working group with an overarching charter of promoting both workplace wellness and personal wellbeing to ARRS members of each practice type, private or academic, at every stage of their career, from residency to fellowship to active practice and beyond.
For “Words of Wellness” here in InPractice, members of the ARRS Quality and Practice Improvement Subcommittee discuss what “wellness” and “wellbeing” mean in their own clinical practices, research focuses, and everyday lives.
Jay Parikh, MD University of Texas MD Anderson Cancer Center
“I am a breast radiologist and professor of radiology in the division of diagnostic imaging at UT MD Anderson Cancer Center. Most physicians go into medicine and endure medical school and radiology residency for the betterment of patients. Along the course of training and further into our careers, data show a high prevalence of burnout in radiology. Additionally, physician burnout has been associated with negative outcomes for organizations, physicians, and patients.
Since burnout is a workplace-related phenomenon, radiology practice leaders need to stop redesigning the radiologist. Instead, they should focus on redesigning processes. Physician leadership is inversely related to burnout. Therefore, practice leaders need to be held accountable for radiologist burnout in their workplaces. Radiologists work very hard to become credentialed and take care of patients, so they should not be marginalized into feeling like cogs in a wheel. The road to overcoming the complex issue of radiologist burnout to wellness requires leaders to listen to their radiologists, co-create solutions, and build trust across their teams.”
Jessica T. Wen, MD, PhD Stanford 2024 ARRS Resident/Fellow in Radiology, Melissa Rosado de Christenson Award Winner
“My journey towards wellness has its roots in yoga. My yoga practice started in college, and during graduate school, I became a certified yoga instructor. During medical school, I taught yoga classes for my fellow medical students, weaving concepts of presence and self-awareness into my classes.
As a trainee, I find that training and wellness are often difficult to reconcile; not just for myself, but also for my colleagues. The aspect of wellness that I struggle with the most is self-care. In medicine, we are trained with the expectation to place the hospital’s needs always before our own. Our training culture has classically praised the individual who finds more of themselves to give, without reprieve or compensation. The internalization of this culture manifests as a loss of self-worth. To balance this, I have found that the pillars of self-care can be derived from both the physical principles of yoga—flexibility and strength—in addition to the yogic principle of community.
Flexibility, strength, and community are the mental and social foundations on which I build my self-care and self-acceptance.”
Darcy J. Wolfman, MD Johns Hopkins Medicine
“Wellness at work starts with processes that improve your life, not impede it. Making your job something you look forward to, not dread. The first step is identifying what at work is leading to stress and unhappiness.
These can be big things, such as we need more staff to cover calls, or small items, such as moving the cutoff time to read cases from 5:00 to 4:30 pm. The hard part is that these changes are extremely practice-specific. What has helped in my practice is likely to be irrelevant to someone else’s. Therefore, it is critical that leadership listen to radiologists and be willing to make changes. There is no one-size-fits-all, and no one outside your practice can tell you what to do. So, it all starts with identifying pain points, and then getting leadership to listen and be willing to change.”
Lauren M.B. Burke, MD, FSAR University of North Carolina at Chapel Hill
I am an abdominal radiologist and professor of radiology and urology at the University of North Carolina at Chapel Hill. In my current role of executive vice chair, I have worked on several initiatives to improve work-life balance across all members of the team: faculty, residents, and staff.
In my view, small tweaks can lead to great improvement. Optimization of worklists to equalize efforts and/or allow for flexibility or remote interpretation has been key to finding that balance of teaching, clinical acuity, and clinical load for our team. These tweaks allow faculty to have autonomy and flexibility in their work and daily lives.
Efforts to help physicians practice at their level are equally important. Automation of protocols, software to propagate measurements from ultrasound examinations straight to reports, and motivated staff to help relay and close the loop on incidental findings are all examples of such efforts. It’s a constant work-in-progress that requires a unified team with open and honest communication between all team members.
Sherry Wang, MD Mayo Clinic, Rochester
I am an abdominal radiologist in the abdominal and ultrasound divisions at Mayo Clinic Rochester. Being a radiologist, I have found much of my source of unwellness and burnout tend to be psychological, rather than physical. There is a lot of mental burden, and it is no surprise that radiology is the most mentally demanding physician specialty with increasing workload contributing to burnout.
Music is something I have always enjoyed, and I’ve curated a “Wellness Playlist”—songs for those mentally tougher days in the reading room. Music has been found to improve mood and decrease anxiety and cortisol levels, even improving depression. Physiologically, music can decrease blood pressure, heart rate, and respiratory rate. In particular, listening to peaceful and low tempo music has been found to decrease heart rate.
There are times in the reading room where I find it useful to have relaxing music to help decrease anxiety and irritation, as well as calm down. However, there are days where I want and need to get pumped up to help tackle a rougher day, just like getting pumped up at the gym for a workout. In fact, motivational music has been shown to combat cognitive and physical performance decline caused by exercise fatigue in sports. Another factor shown to combat cognitive and physical decline is a 30-minute nap. This also showcases the importance and power of sleep, which we are all very aware of in mitigating burnout and unwellness. Since we are on the topic of sleep, listening to relaxing music has been found to be as effective as diazepam in reducing anxiety, and thus beneficial for aiding sleep. Music can lower our blood pressure, heart rate, and respiratory rate to help us fall asleep and achieve quality sleep, further boosting our wellness.
Jan Vosshenrich, MD Department of Radiology University Hospital Basel, Switzerland
The health care sector—and especially medical imaging—greatly contributes to global greenhouse gas emissions. Recent research has highlighted the colossal energy appetite of CT and MRI scanners, spotlighting substantial nonproductive energy waste during idle periods (1–3).
But do interventional radiology and interventional cardiology face similar energy consumption challenges?
To find the answer, my University Hospital Basel colleagues from the departments of radiology, cardiology, urology, and building management equipped interventional imaging devices with power sensors and calculated their energy demand, carbon emissions, and annual costs (4).
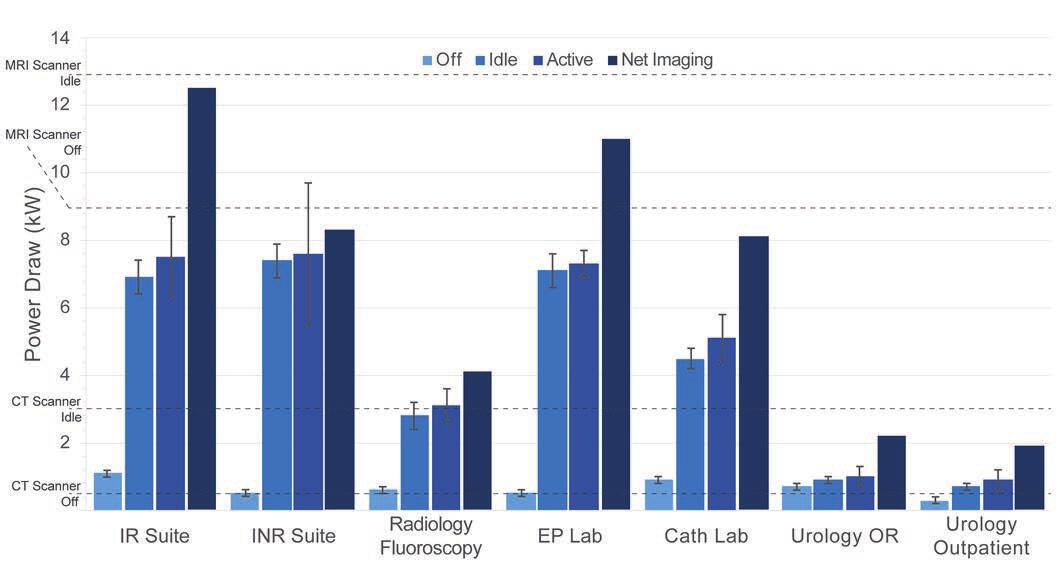
The idle power consumption of CT scanners and basic fluoroscopy devices (e.g., used for peripherally inserted central catheter line insertions) is around 3 kilowatt-hours (kWh). Biplanar angiography devices used in interventional radiology and catherization labs have around 2–2.5 times higher power requirements, ranging between 5–7.5 kWh (Fig. 1)
Fig. 1—Mean power draw in kilowatts (kW), stratified by system and activity states. Error bars represent SDs. Values for net imaging state were estimated and lack SDs. Dashed horizontal lines represent mean power draws in off and idle states of CT scanner and of MRI scanner without power-saver mode, based on published data. EP = electrophysiology, INR = interventional neuroradiology, IR = interventional radiology, OR = operating room, lab = laboratory, cath = catheterization
Simply powering down these devices when not in use decreased power consumption and increased energy efficiency by 22–93%. System shutdowns could be safely practiced without causing damages, affecting the systems’ lifespan, or voiding service warranties.
Vendors have started to encourage customers to consistently power down systems overnight and during idle periods longer than an hour in their best practice guidelines. If you do not already shut down your imaging devices, our AJR Original Research article includes projected annual savings for doing so.
On a device level, consistently powering down idle-running devices overnight and on weekends may save up to 39,000 kWh in energy consumption, 5 metric tons in greenhouse gas emissions, and $10,000 in electricity costs.
For multiple devices, savings add up!
Based on their institutional setting, we estimated combined annual savings of 144,640 kWh in energy consumption, 18.6 metric tons in greenhouse gas emissions, and $37,896 in electricity costs. The included cost and carbon emission sensitivity analyses allow radiology, cardiology, and urology departments to estimate their potential cost savings and sustainability benefits, depending on local electricity prices and carbon intensities accordingly.
Savings vary with usage patterns and may be lower for practices offering around-the-clock emergency procedures. However, switching off can still pay off without sacrificing readiness and prompt care, given short start-up and shutdown times of modern devices (ca. 2–5 minutes).
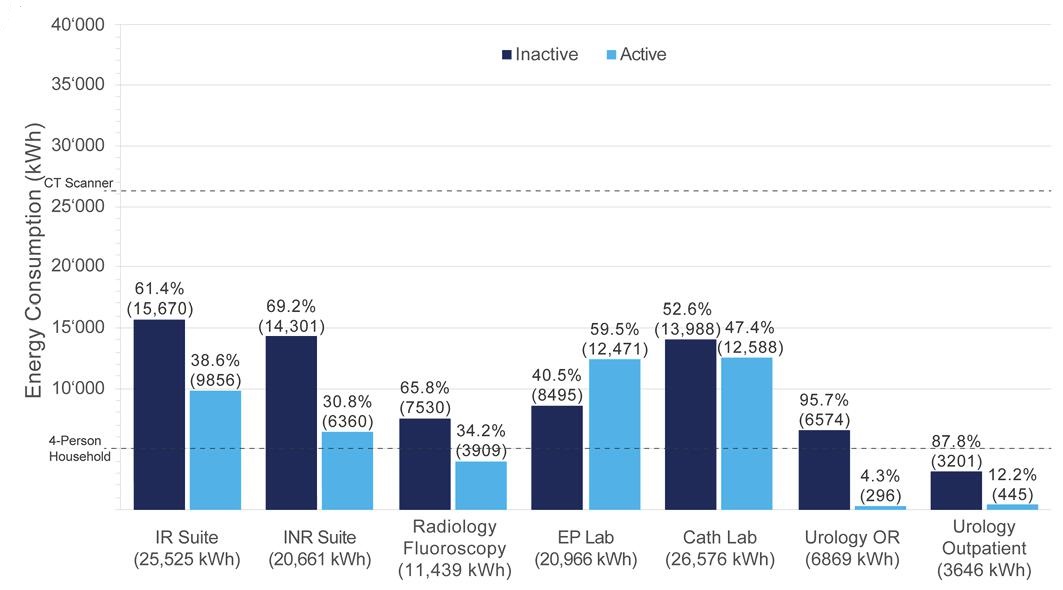
But even when consistently powering down idle-running systems (Fig. 2), most of the devices’ energy consumption still occurred inactively without a patient being in the room for a procedure (overall: ~60%, range for individual devices: ~41-96%.)
Fig. 2: Projected annual inactive and active energy consumption (i.e., energy consumption occurring outside of and during procedures, respectively). Dashed horizontal lines represent mean annual energy consumption of 4-person household and of CT scanner, based on published data. EP = electrophysiology, INR = interventional neuroradiology, IR = interventional radiology, OR = operating room, lab = laboratory, cath = catheterization
Given how the energy consumption of the devices is distributed, we concluded that there is much room left to further improve sustainability in interventional radiology. However, these would require technical innovations and more eco-friendly designs from the systems’ manufacturers.
In summary, interventional imaging systems are energy intensive in their operation. The annual energy demand of each device is as high as that of 1 to 5 4-person households. Nonproductive energy consumption outside procedures is disproportionately high. Powering down idle-running devices can decrease costs and increase sustainability. Meanwhile, system shutdowns and start-ups can be safely and quickly performed. However, technical innovations are needed to further improve sustainability in interventional radiology writ large.
For more reasons why now is the perfect time to ramp up your sustainable imaging efforts, “the yellow journal” has since published multiple Editorial Comments for our full-length manuscript—authored by individuals who served as the article’s peer reviewers before acceptance (i.e., those most familiar with its content). AJR Editorial Comments by Nadja Kadom [5] and by Katherine Frederick-Dyer [6] offer insights from different perspectives regarding the energy consumption of interventional imaging equipment. It’s worth noting, too, that the AJR Global team has published Chinese and Spanish translations, both PDF and audio files, for our article’s abstract.
References
Brown M, Schoen JH, Gross J, Omary RA, Hanneman K. Climate change and radiology: impetus for change and a toolkit for action. Radiol 2023 May; 307:e230229
Picano E, Mangia C, D’Andrea A. Climate change, carbon dioxide emissions, and medical imaging contribution. J Clin Med 2022 Dec 27; 12:215
Brown M, Snelling E, De Alba M, Ebrahimi G, Forster BB. Quantitative assessment of CT energy use and cost savings through overnight and weekend power down in a radiology department. Canadian Association of Radiologists Journal 2023; 74:298–304
Vosshenrich J, Mangold D, Aberle C, et al. Interventional imaging systems in radiology, cardiology, and urology: energy consumption, carbon emissions, and electricity costs. AJR 2024 Mar 20 [published online]. Accepted manuscript. doi:10.2214/AJR.24.30988
Kadom N. Editorial comment: The time to start is now. AJR 2024 Mar 27 [published online]. Accepted manuscript. doi:10.2214/AJR.24.31188
Frederick-Dyer K. Editorial comment: Let’s not be idle about idle power consumption. AJR 2024 Apr 3 [published online]. Accepted manuscript. doi:10.2214/AJR.24.31222
Director for Quality, Department of Radiology, Children’s Healthcare of Atlanta Interim Director for Quality, Department of Radiology and Imaging Sciences, Emory Healthcare
Professor, Emory University School of Medicine
Living more sustainably has been on my mind recently, and I think other radiologists may be similarly interested. As radiologists, we play a crucial role in diagnosing and treating patients, and I strongly believe that we can do even more.
Radiology, being an essential component of modern health care, has an environmental impact, particularly in terms of energy consumption and waste generation. However, I also believe that there are opportunities for positive change. By adopting sustainable practices in our radiology departments, we can reduce our ecological footprint and contribute to a healthier planet.
As Dr. Julia H. Schoen noted in her own InPractice primer, “greener” imaging begins at home [1], so I would love to discuss potential initiatives that radiologists could undertake together, starting with our use of iodinated contrast media (ICM). Accumulating as residual waste in the vials and tubing of patients who receive them, ICM can be released into the sewage system. Although ICMs are of low toxicity, they may transform into other chemicals when undergoing wastewater treatment and/or water purification [2]. These byproducts pose risks for aquatic environments, as well as our drinking water.
Following the shortages of iodinated contrast agents during the COVID pandemic, many radiology practices had to adopt new best practices for decreasing use and waste of iodinated IV contrast [3]. So, with supply chain disruptions resolving and inventory returning, why not adjust contrast volume for each patient based on body weight, lean body mass, or body surface? Certain imaging techniques can allow reduced IV contrast volumes, currently mostly used for patients with renal disease: low-kV techniques, dual-energy scanning with reconstruction of low-keV images, and contrast boost technique for CT angiography.
Using multi-patient injection systems for bottle sizes up to 500 milliliters can make IV contrast administration even more efficient by individualizing the amount of contrast material injected without increasing contrast waste. True, this may require some planning ahead of the imaging day to do so efficiently.
Changing habits is difficult, but do you switch the lights off when you leave a room in your home? How about at work? It’s tough to remember every time, I know. We often feel like a big, concerted effort is necessary to change one single bad habit, and it remains unclear whether such a small contribution can really make a difference.
Hang in there! The 1% rule of marginal gains is the simple idea that big goals can be achieved through incremental steps. No need for making big changes overnight. Instead, let’s aim for small daily improvements.
The three “r”s of sustainability—reduce, reuse, recycle—definitely do translate to our specialty, and there are a few low-hanging fruits worth our consideration. Remember, adopting environmentally friendly practices can also save money, and rethinking how we administer ICM is a feasible first step.
Dekker HM, Stroomberg GJ, Prokop M. Tackling the increasing contamination of the water supply by iodinated contrast media. Insights Imaging 2022 Feb 24; 13:30. doi: 10.1186/s13244-022-01175-x
The American Roentgen Ray Society (ARRS) was but a teenager when the city of Boston, MA, first hosted an ARRS Annual Meeting. Dr. Henry Khunrath Pancoast (of “Pancoast lung tumor” fame) presided over that 1913 convocation in Boston, and North America’s first radiological society would return to the cradle of liberty for six more meetings before the 20th century was over.
The 2024 ARRS Annual Meeting at Boston’s John B. Hynes Veterans Memorial Convention Center delivered the same clinically relevant experience for which this society has long been heralded. From Sunday, May 5 to Thursday, May 9, radiologists of each practice type and every training level relished world-class instruction from trusted experts spanning every subspecialty.
Pioneers in asynchronous education a decade before COVID-19 changed everything, ARRS continues to offer both in-person and virtual registrants the most flexible meeting experience in radiology. From Instructional Courses and Scientific Sessions to Categorical Courses and Online Posters, all #ARRS24 attendees retain on-demand access to the complete program for an entire calendar year, learning and earning CME well into 2025.
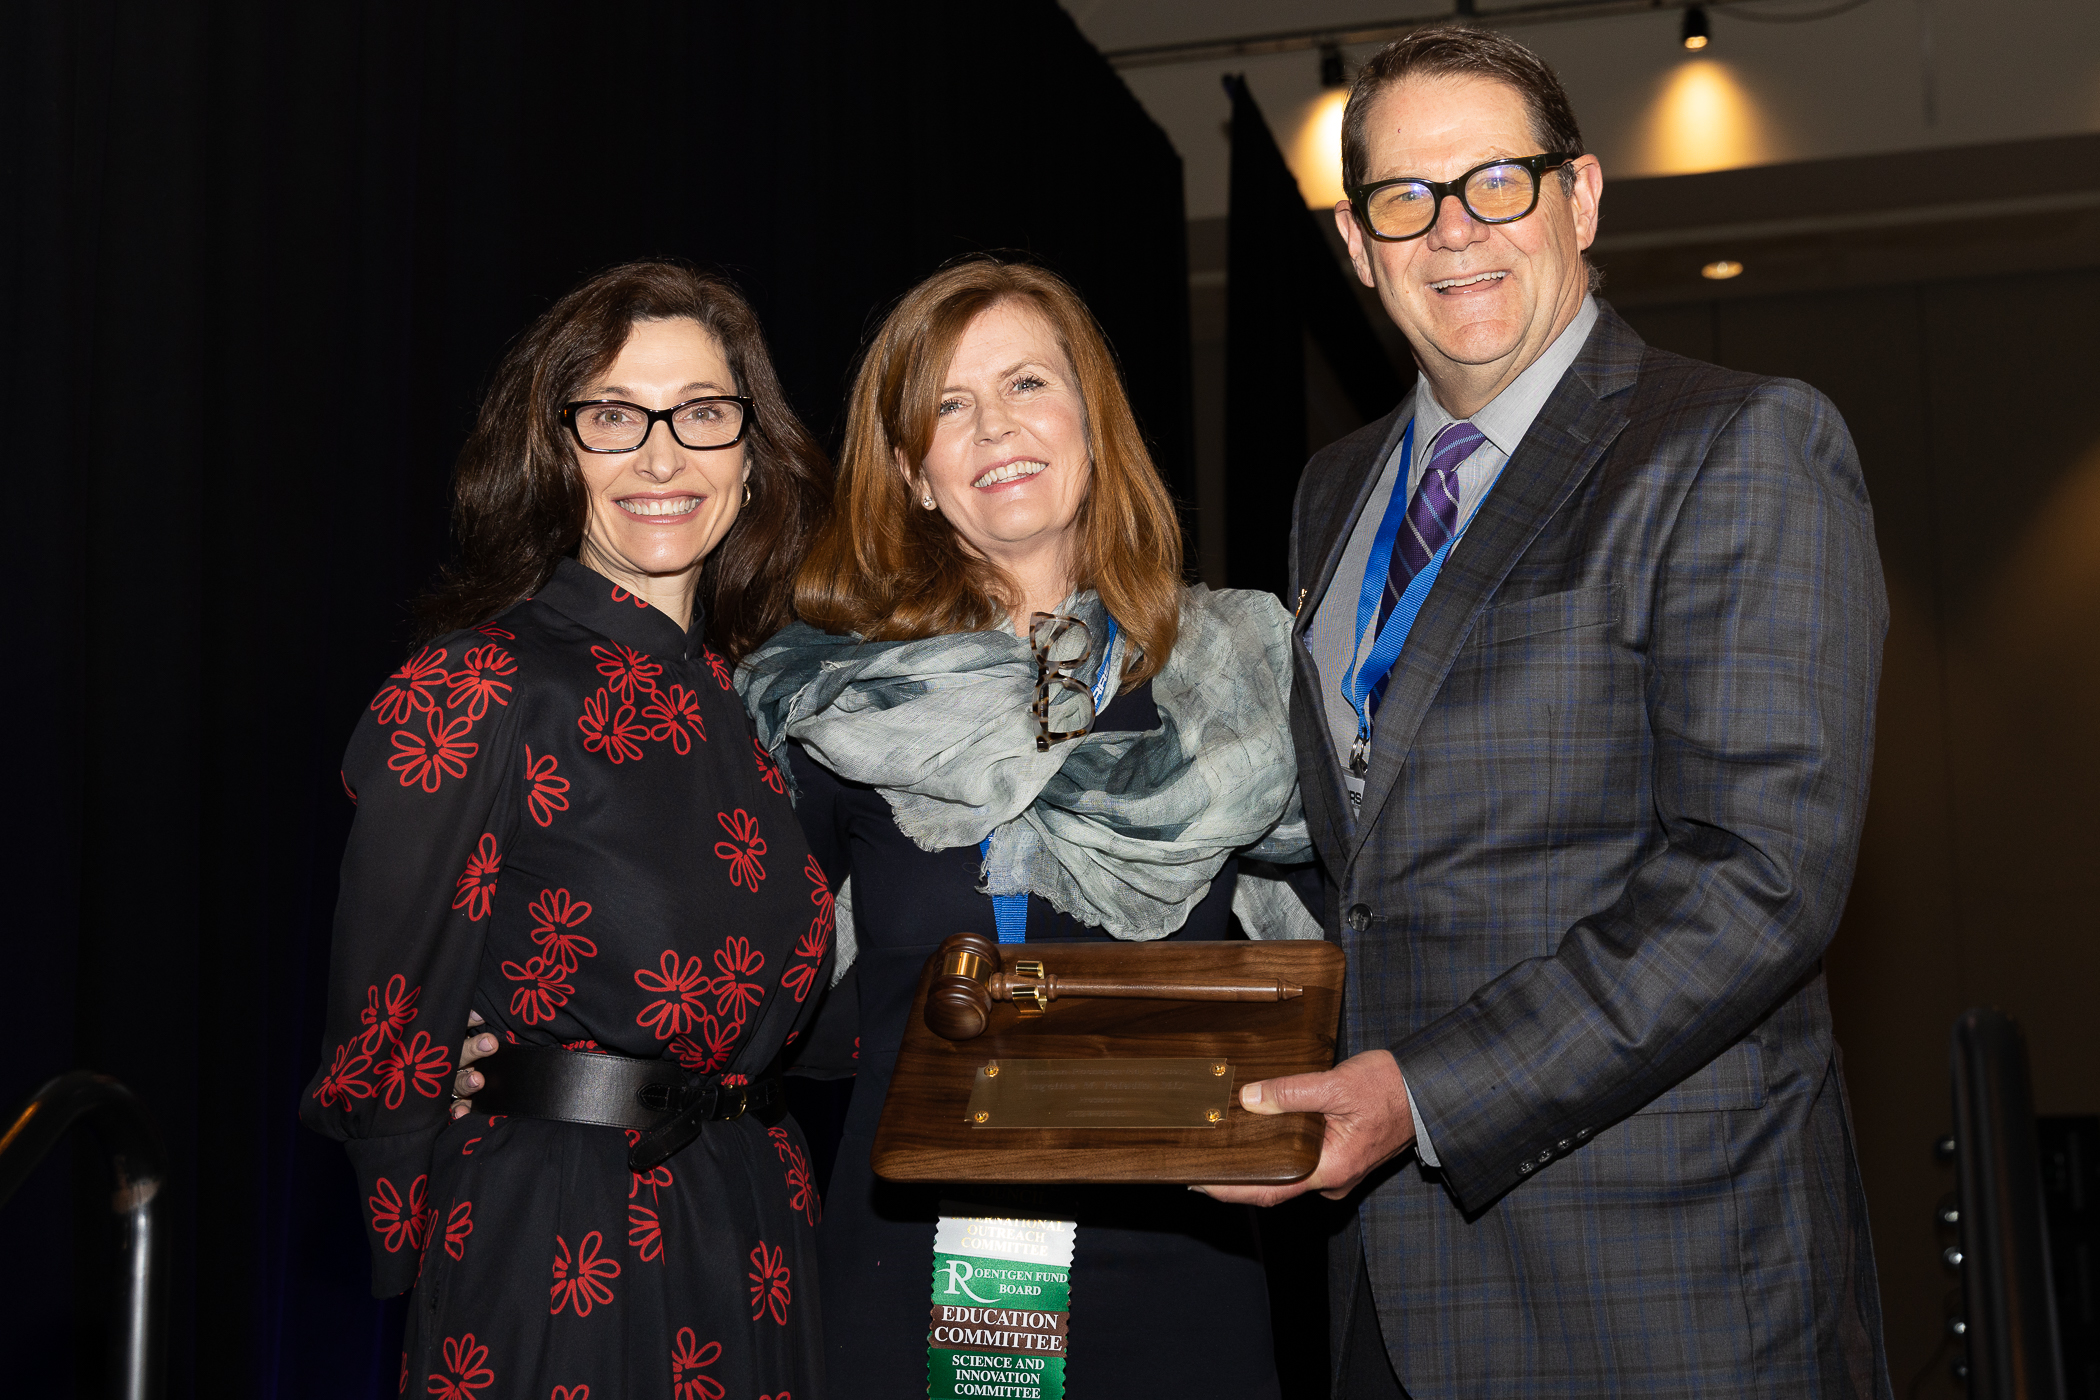
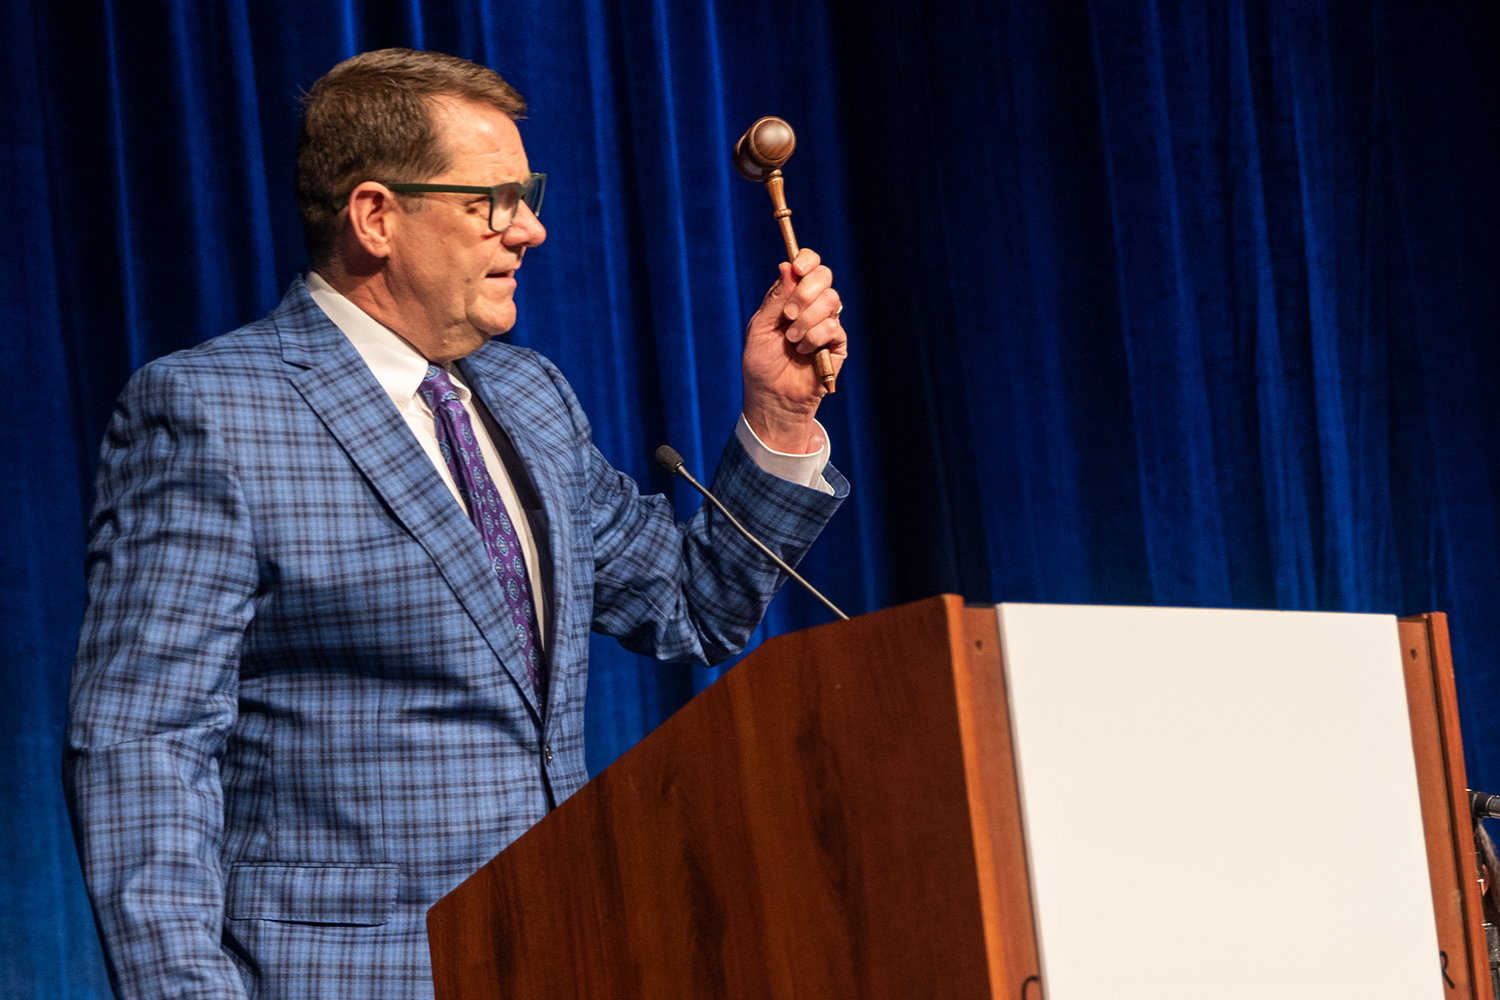
After voting “yea” on a bylaw amendment to streamline the selection of committee chairs, the ARRS membership officially installed Angelisa Paladin, MD, of the University of Washington in Seattle as the 124th president of ARRS. Joining Dr. Paladin are the following newly elected ARRS officers for 2024–25: president-elect Deborah A. Baumgarten, MD, MPH; vice president Christine M. Glastonbury, MD; and secretary-treasurer Reginald F. Munden, MD, DMD, MBA.
Left to right: Christine Glastonbury, Angelisa Paladin, Erik Paulson
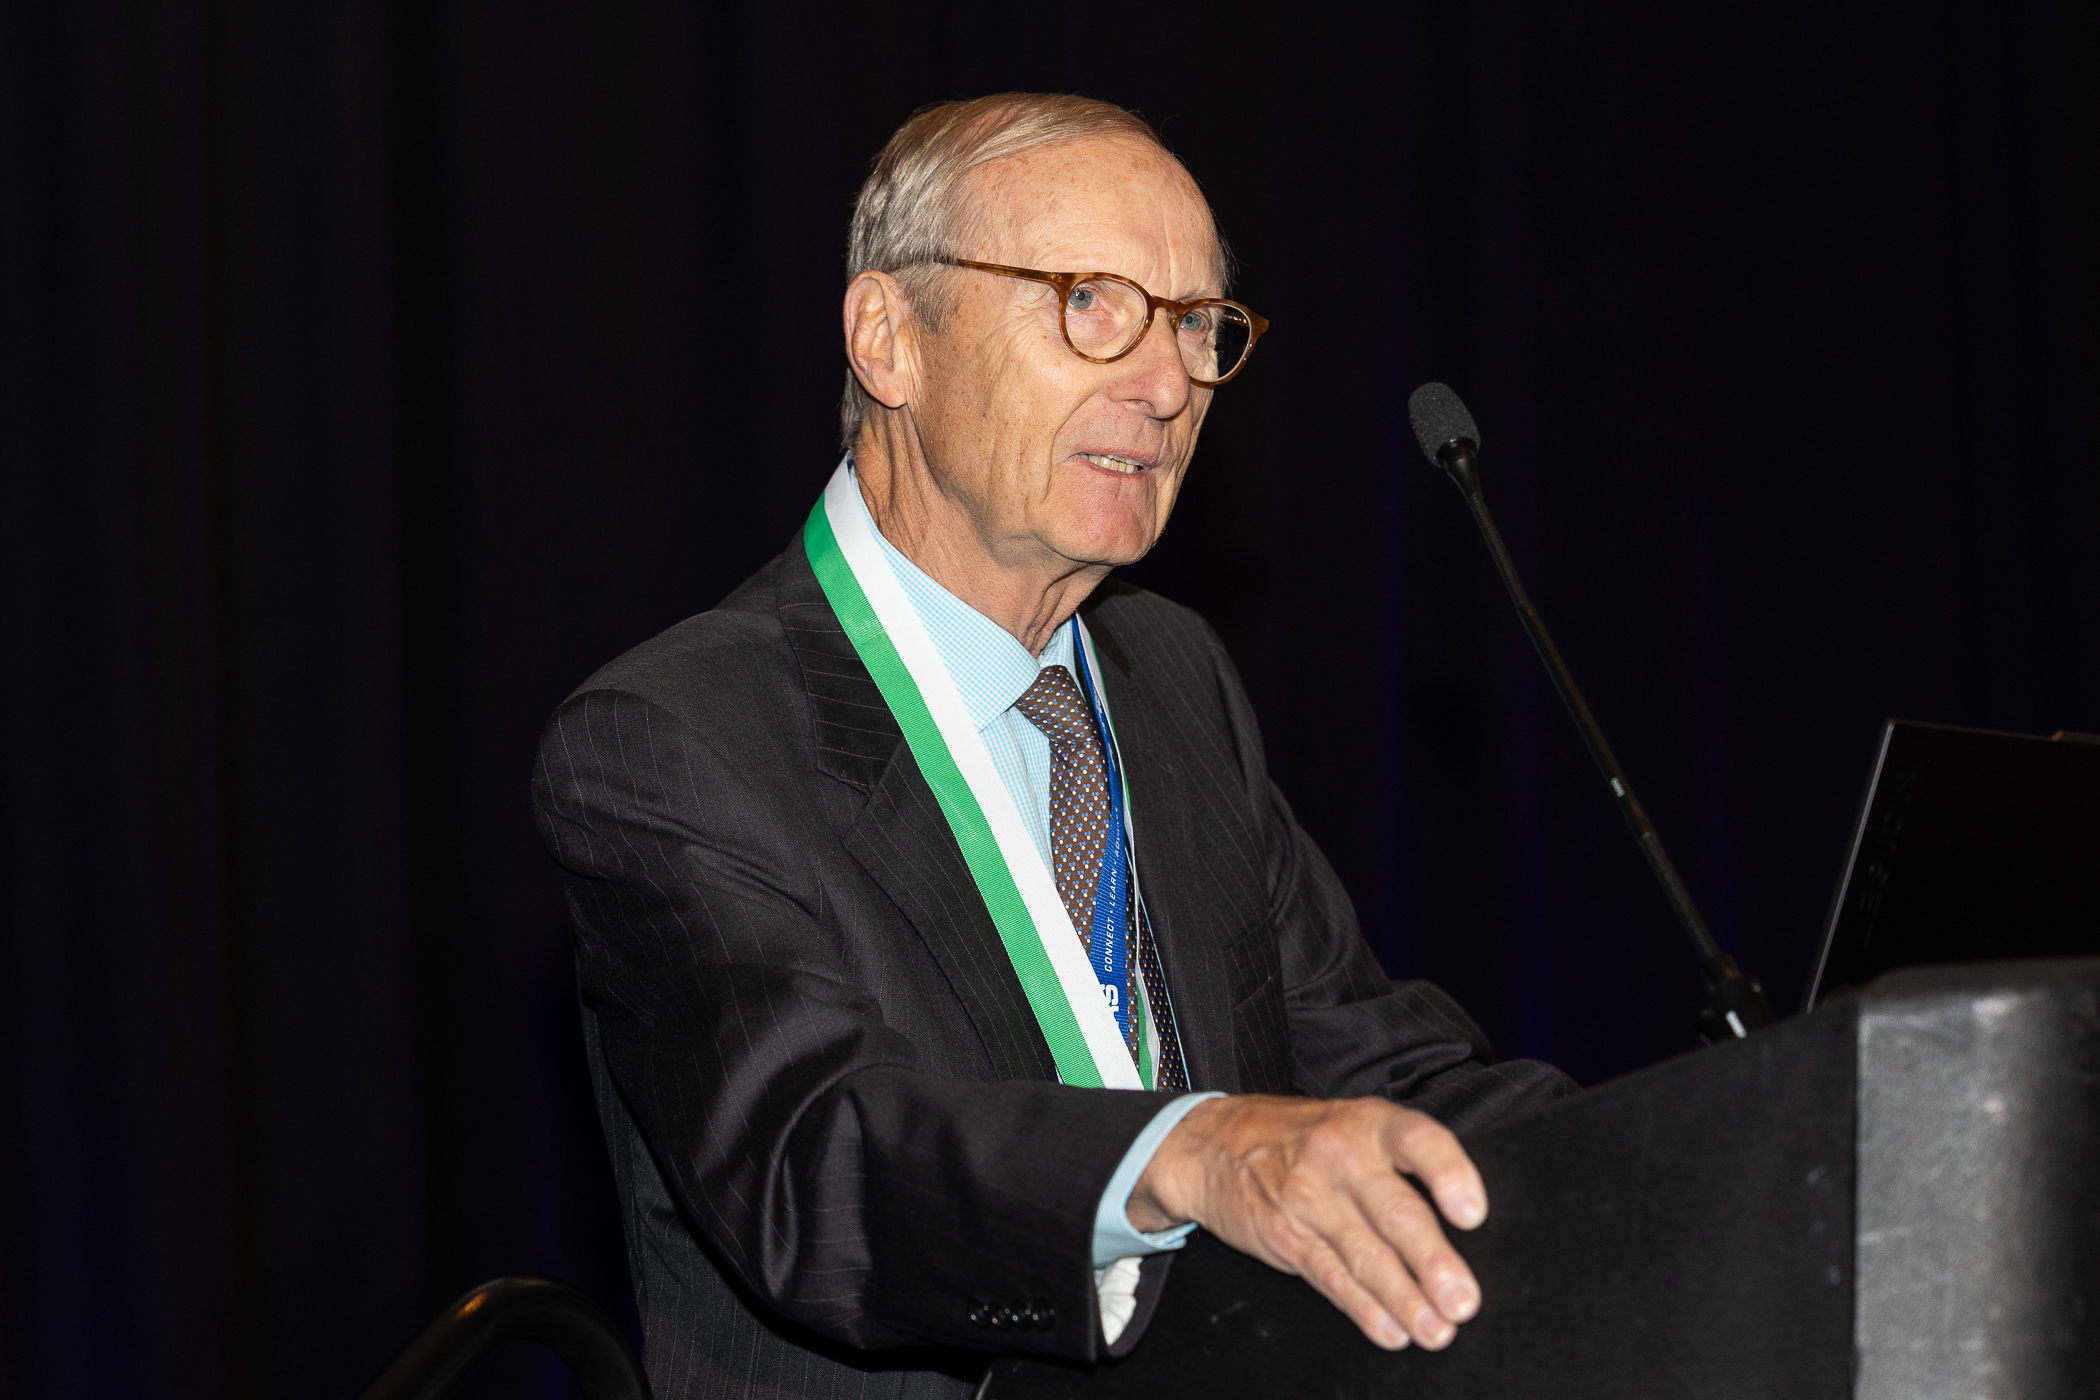
Dr. Paladin succeeds Erik K. Paulson, MD, who presented this year’s coveted ARRS awards. The first laurels of the morning went to Philip Costello, MD, who was awarded the 2024 ARRS Gold Medal. The highest distinction bestowed by ARRS, our Gold Medal has been honoring distinguished service to radiology for more than four decades. Gaveled in as ARRS President during the 2018 Annual Meeting in Washington, DC, presently, Dr. Costello chairs the six vital scholarship programs of ARRS’ own Roentgen Fund®.
Philip Costello
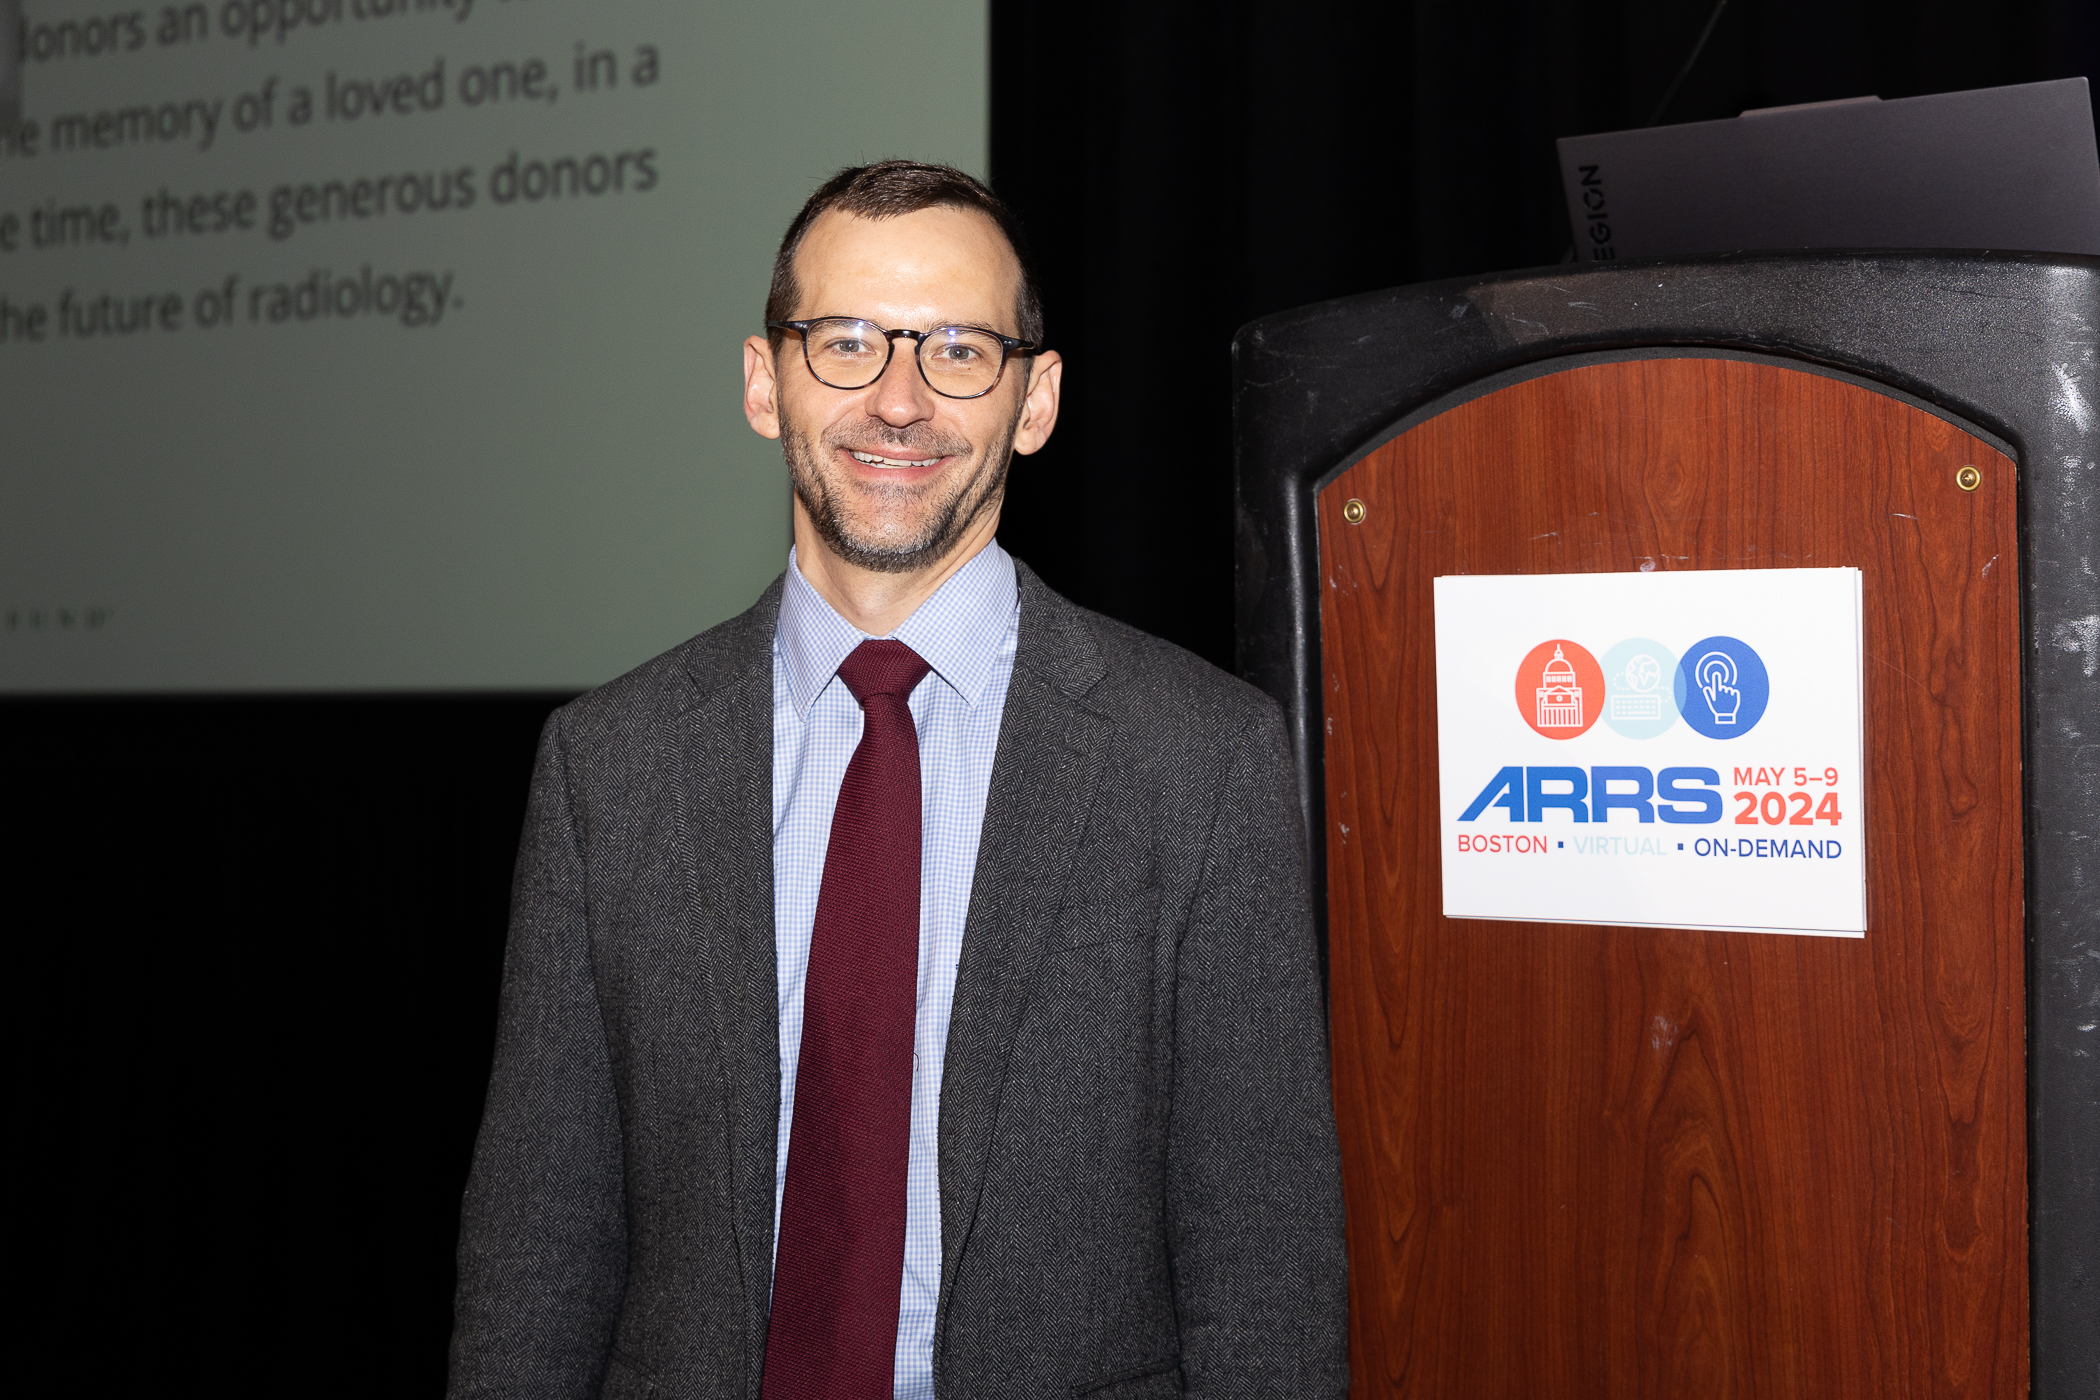
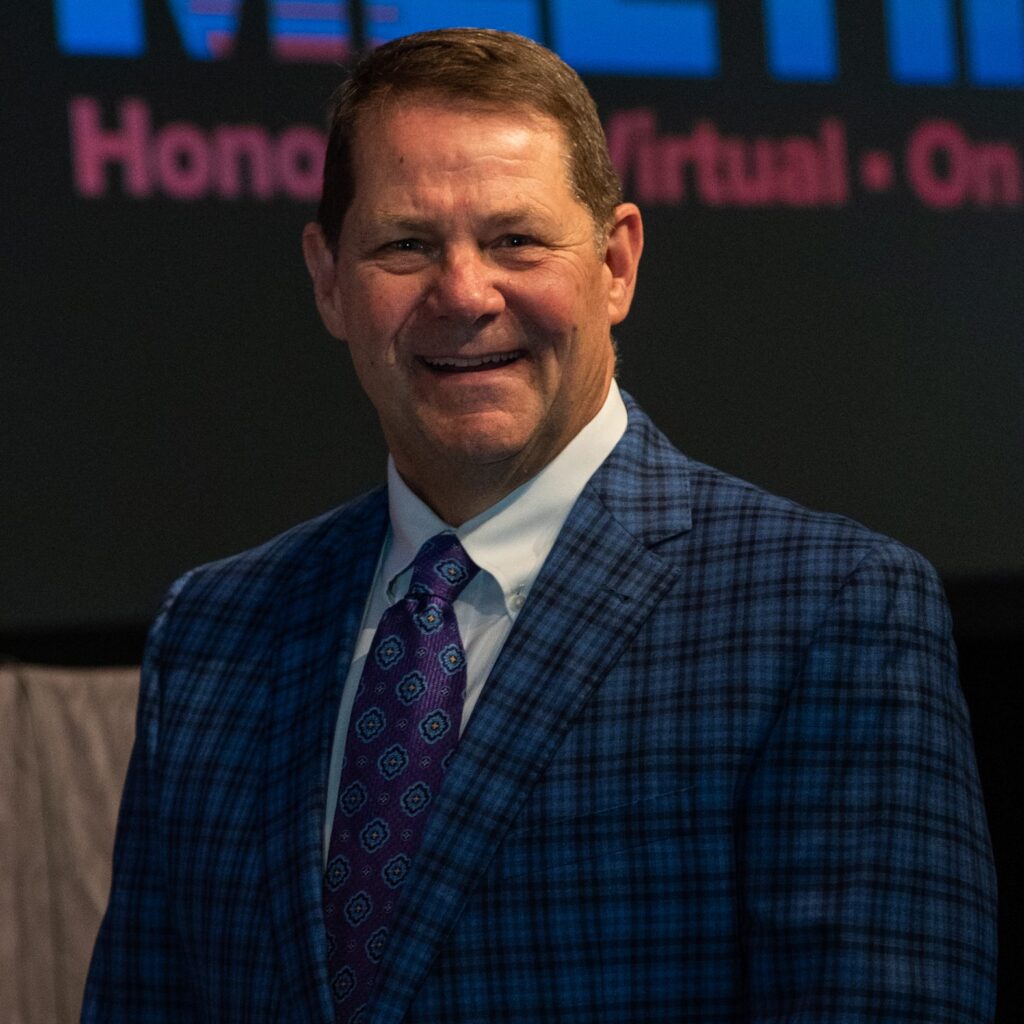
David M. Neager, MD, was then recognized as the 2024 ARRS Distinguished Educator. An engaging presence who motivates and impacts learners and colleagues alike, he exhibits his commitment to ARRS’ own educational initiatives—especially the Clinician Educators Development Program and Radiology Review Track—with attention to the needs and diversity of our members.
David Naeger
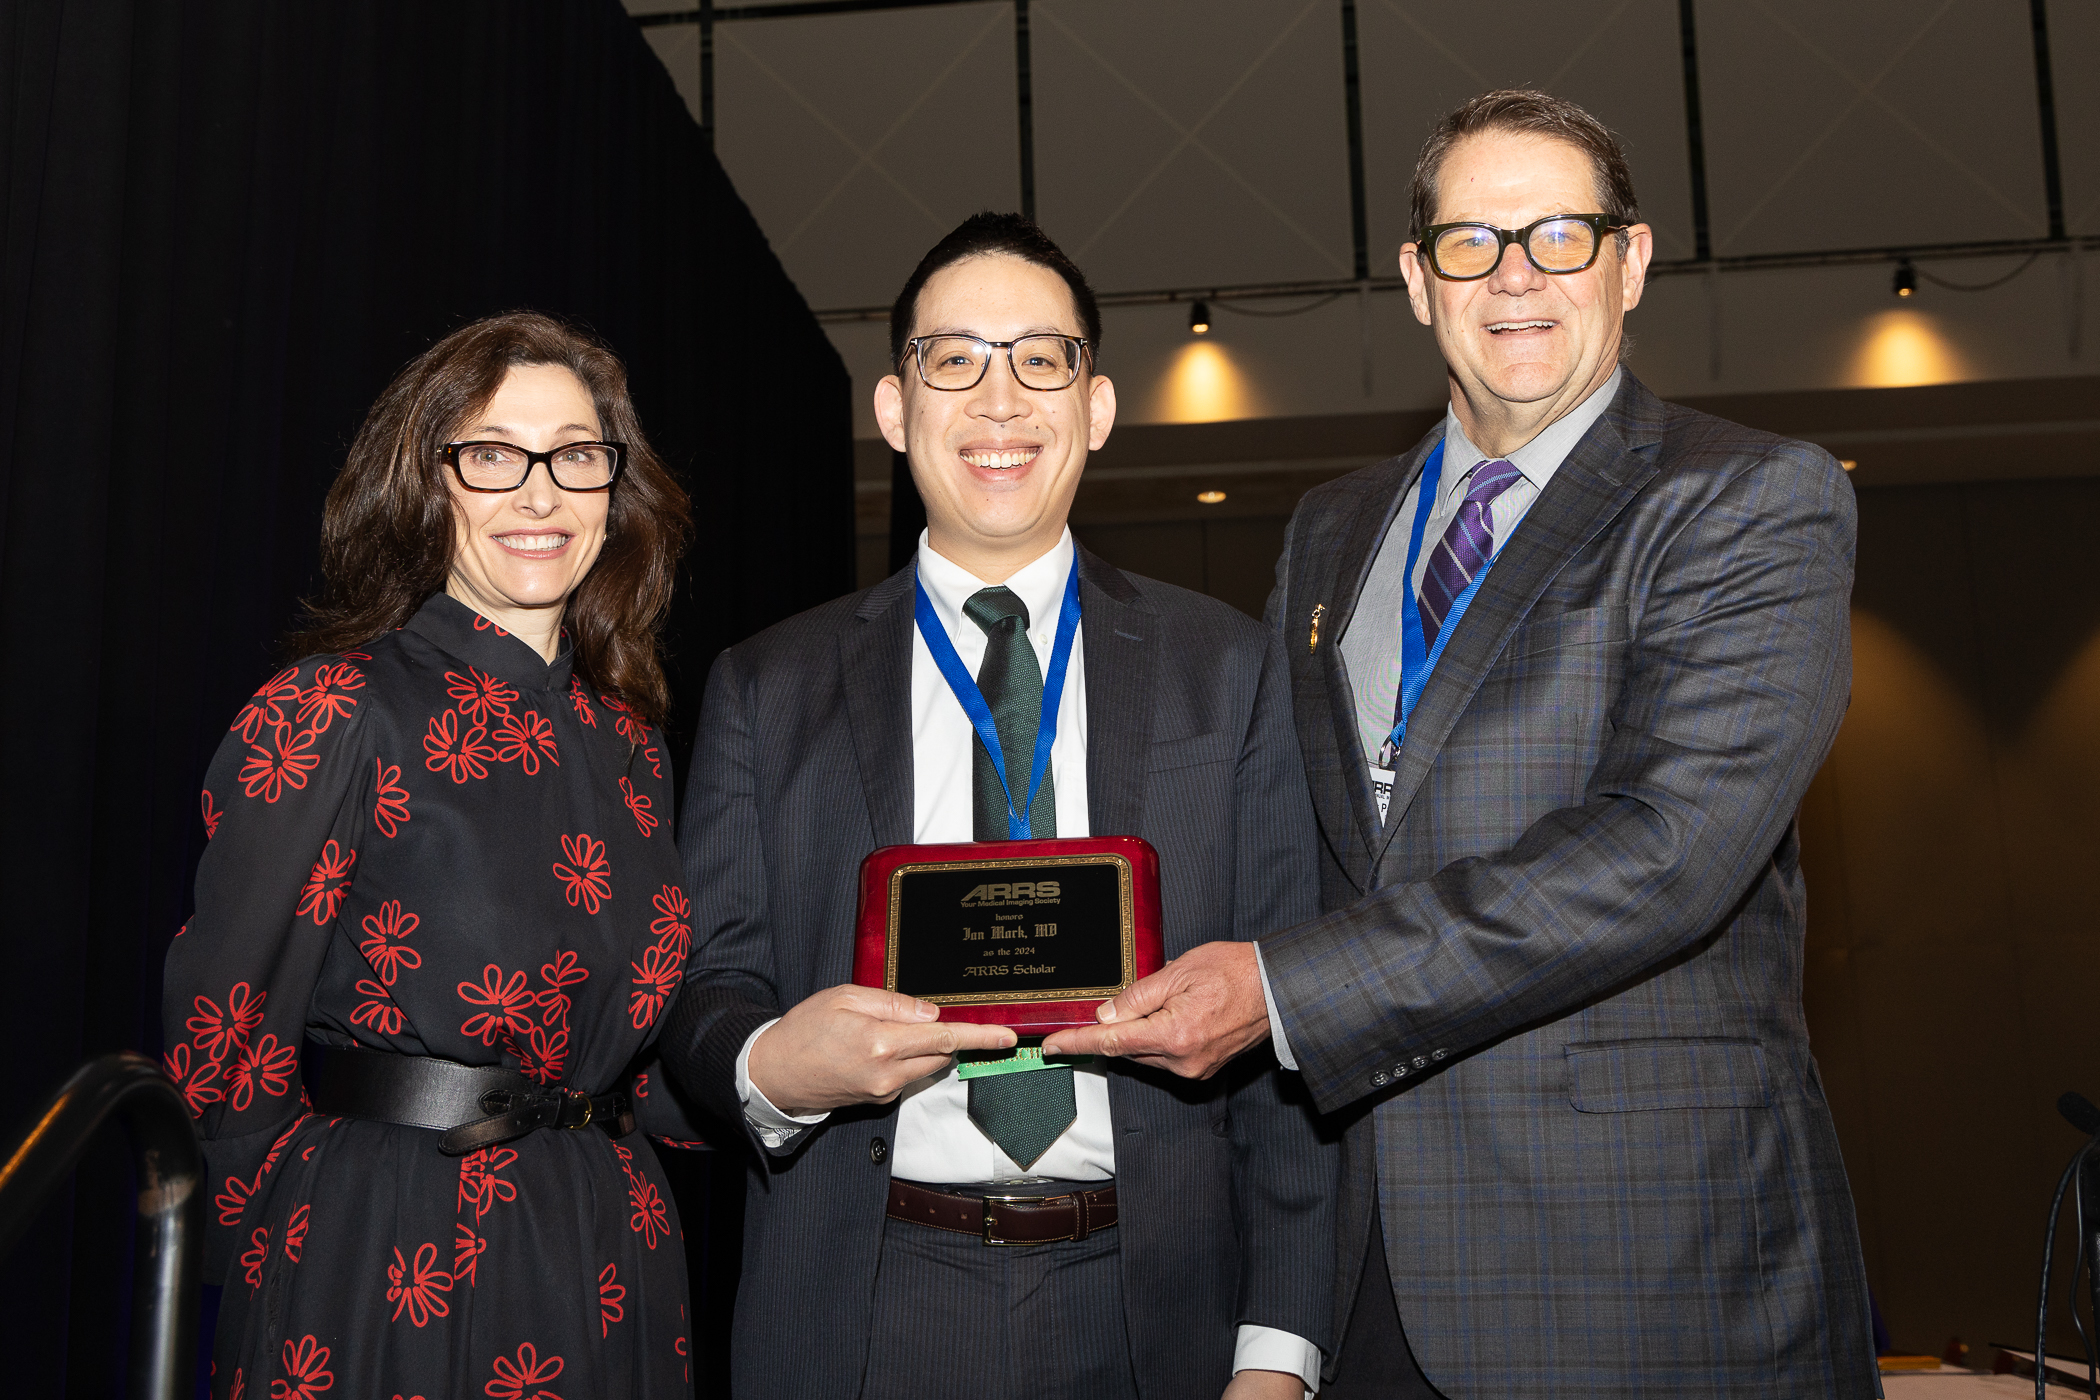
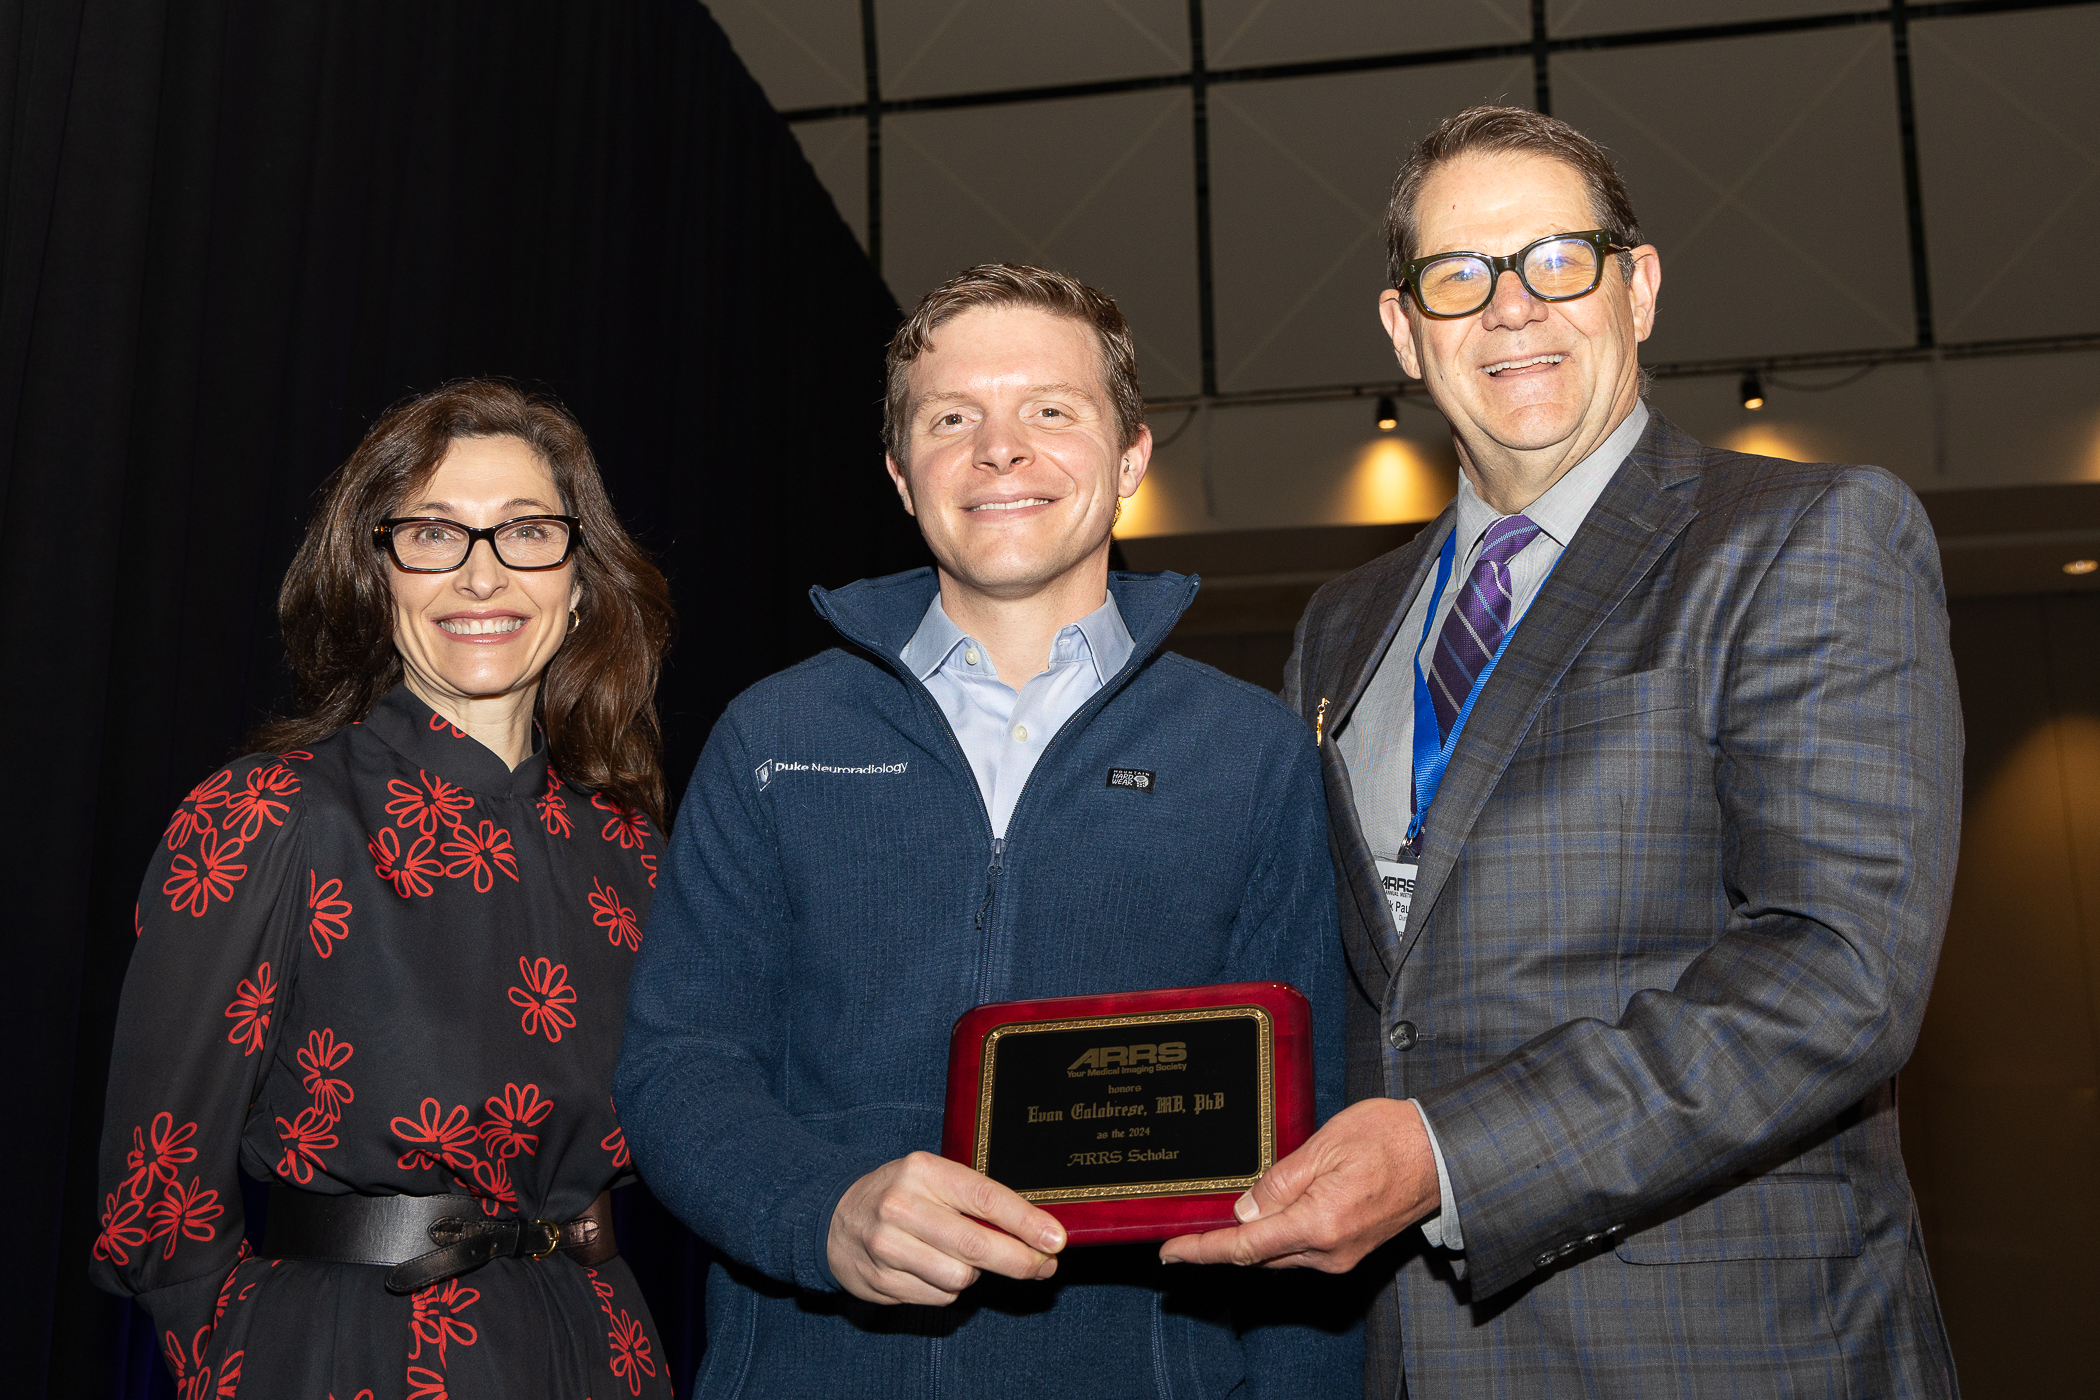
Next, ARRS was proud to recognize two recipients of 2024 ARRS Scholarships: Ian Mark, MD,of Mayo Clinic Minnesotaand Evan Calabrese, MD, PhD, of Duke University Medical Center. Also provided by the Roentgen Fund, the ARRS Scholarship supports early-career faculty members pursuing radiological research that promises to change how medical imaging is practiced. A two-year grant totaling $180,000, the ARRS Scholarship aims to advance emerging scholars, as well as prepare them for positions of leadership.
Left to right: Glastonbury, Ian Mark, PaulsonLeft to right: Glastonbury, Evan Calabrese, Paulson
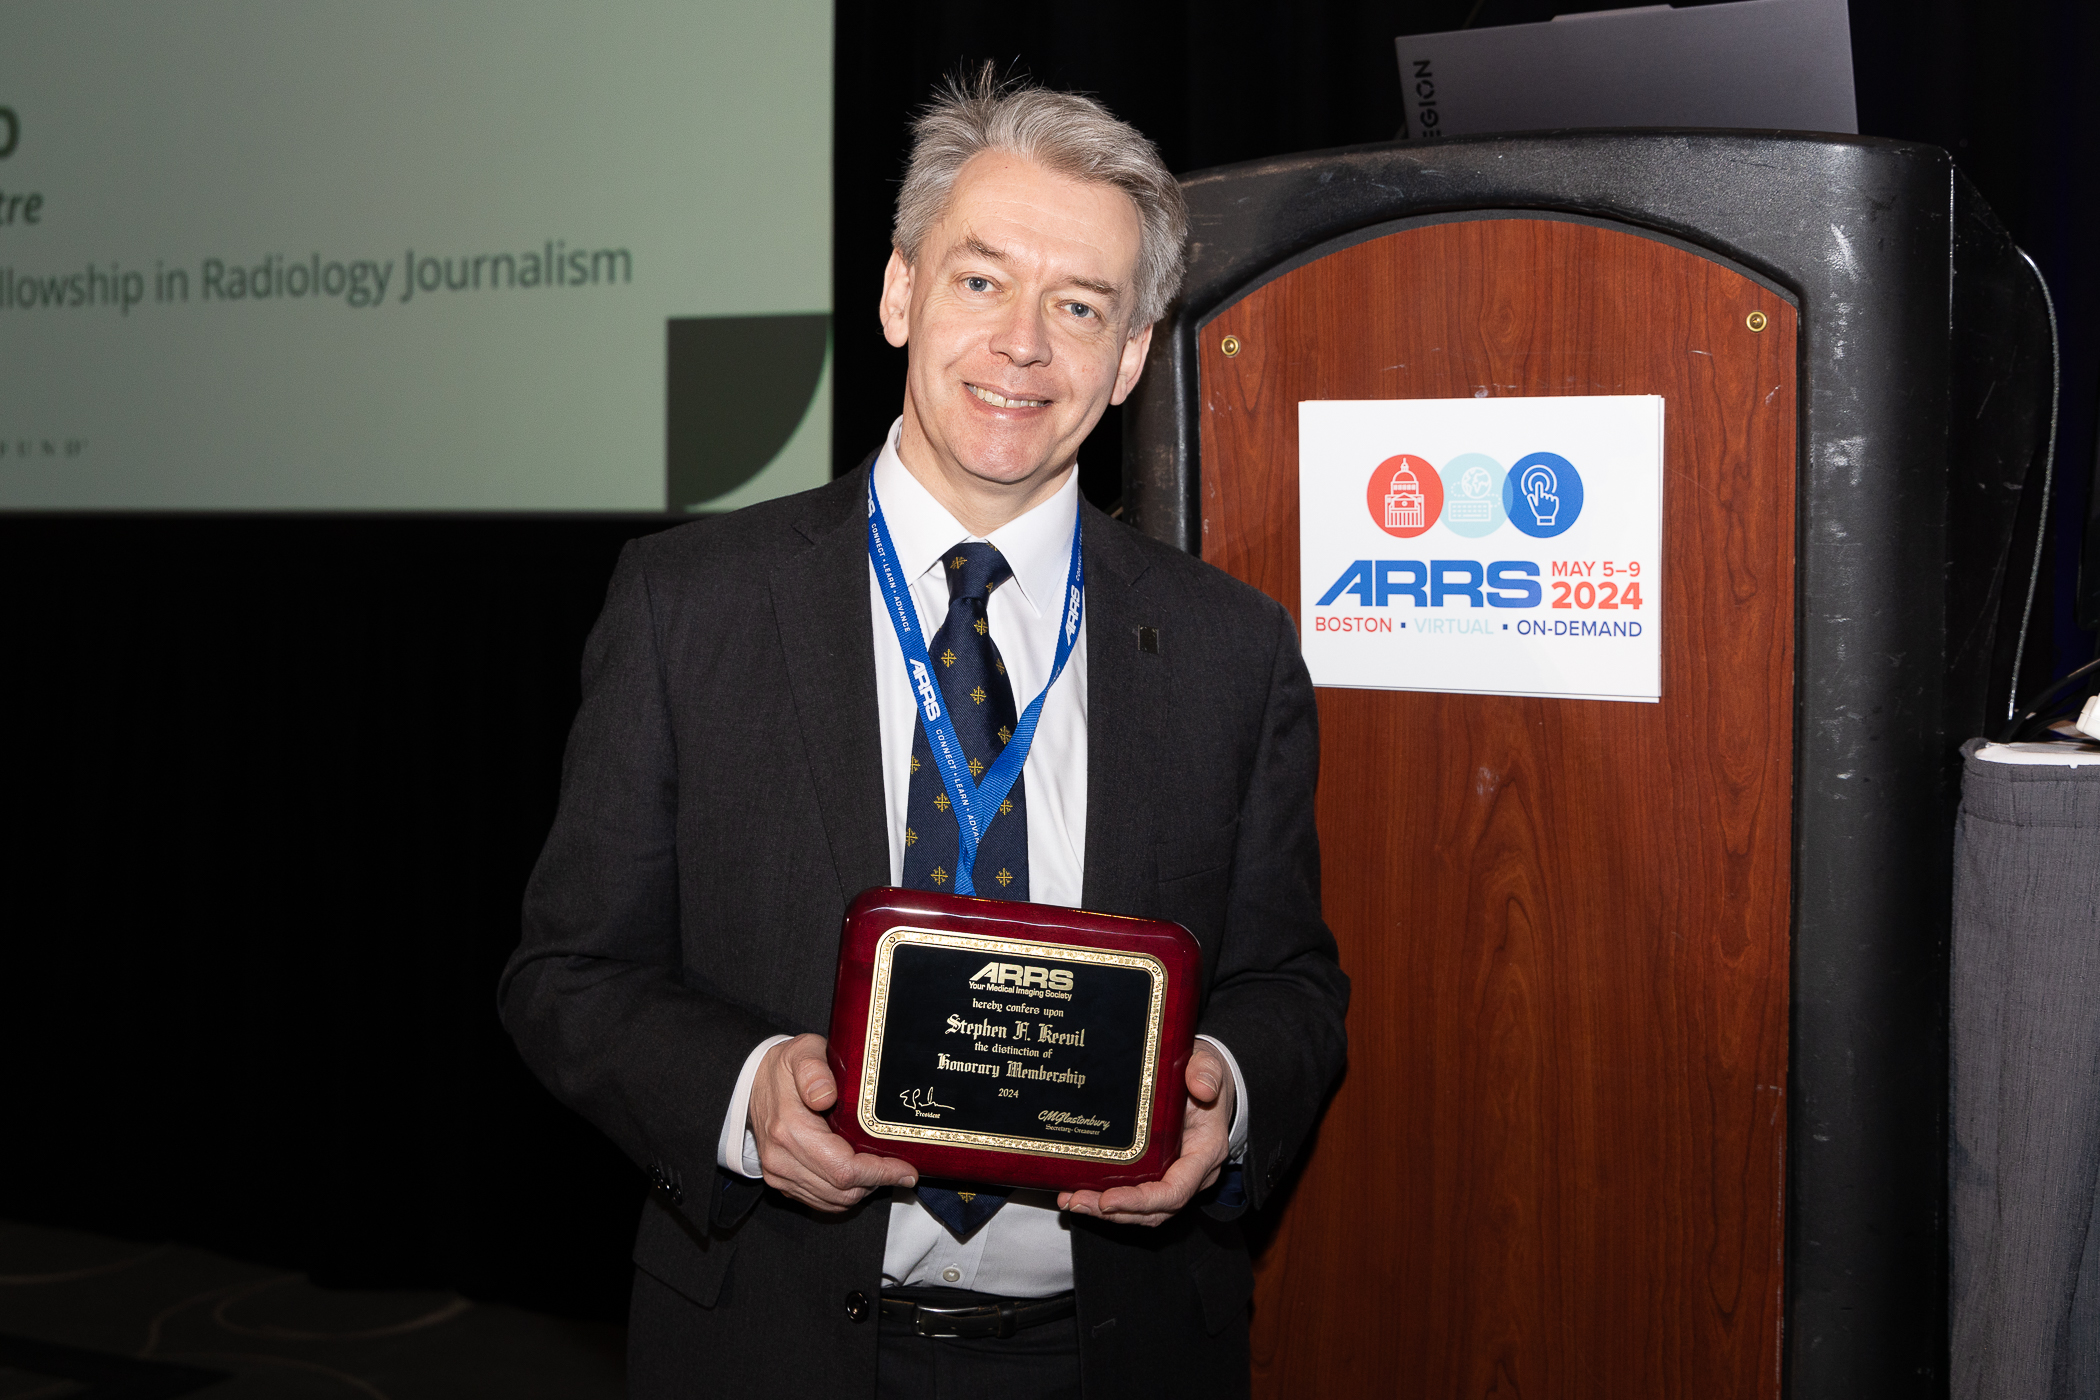
Stephen Keevil, BIR President, Named Honorary Member
Professor Stephen F. Keevil, president of the British Institute of Radiology (BIR)—the oldest medical imaging society in the world—was recognized with honorary membership as part of ARRS’ Global Partner Society (GPS) program. Keevil served on the faculty for the 2024 ARRS Annual Meeting Global Exchange, “Screening Patient Pathways Across the Pond: Highlights and Challenges for Radiology in the UK and USA.” The GPS program was established to build long-standing relationships with key leaders and societies in the global imaging community to enhance understanding, raise awareness, and increase participation in programs and services. The Annual Meeting Global Exchange incorporates one partner society annually into the educational and social fabric of the meeting, with ARRS reciprocating at the partner society’s meeting that year.
Stephen Keevil
2024 AJR Luncheon with Figley and Rogers Journalism Fellows
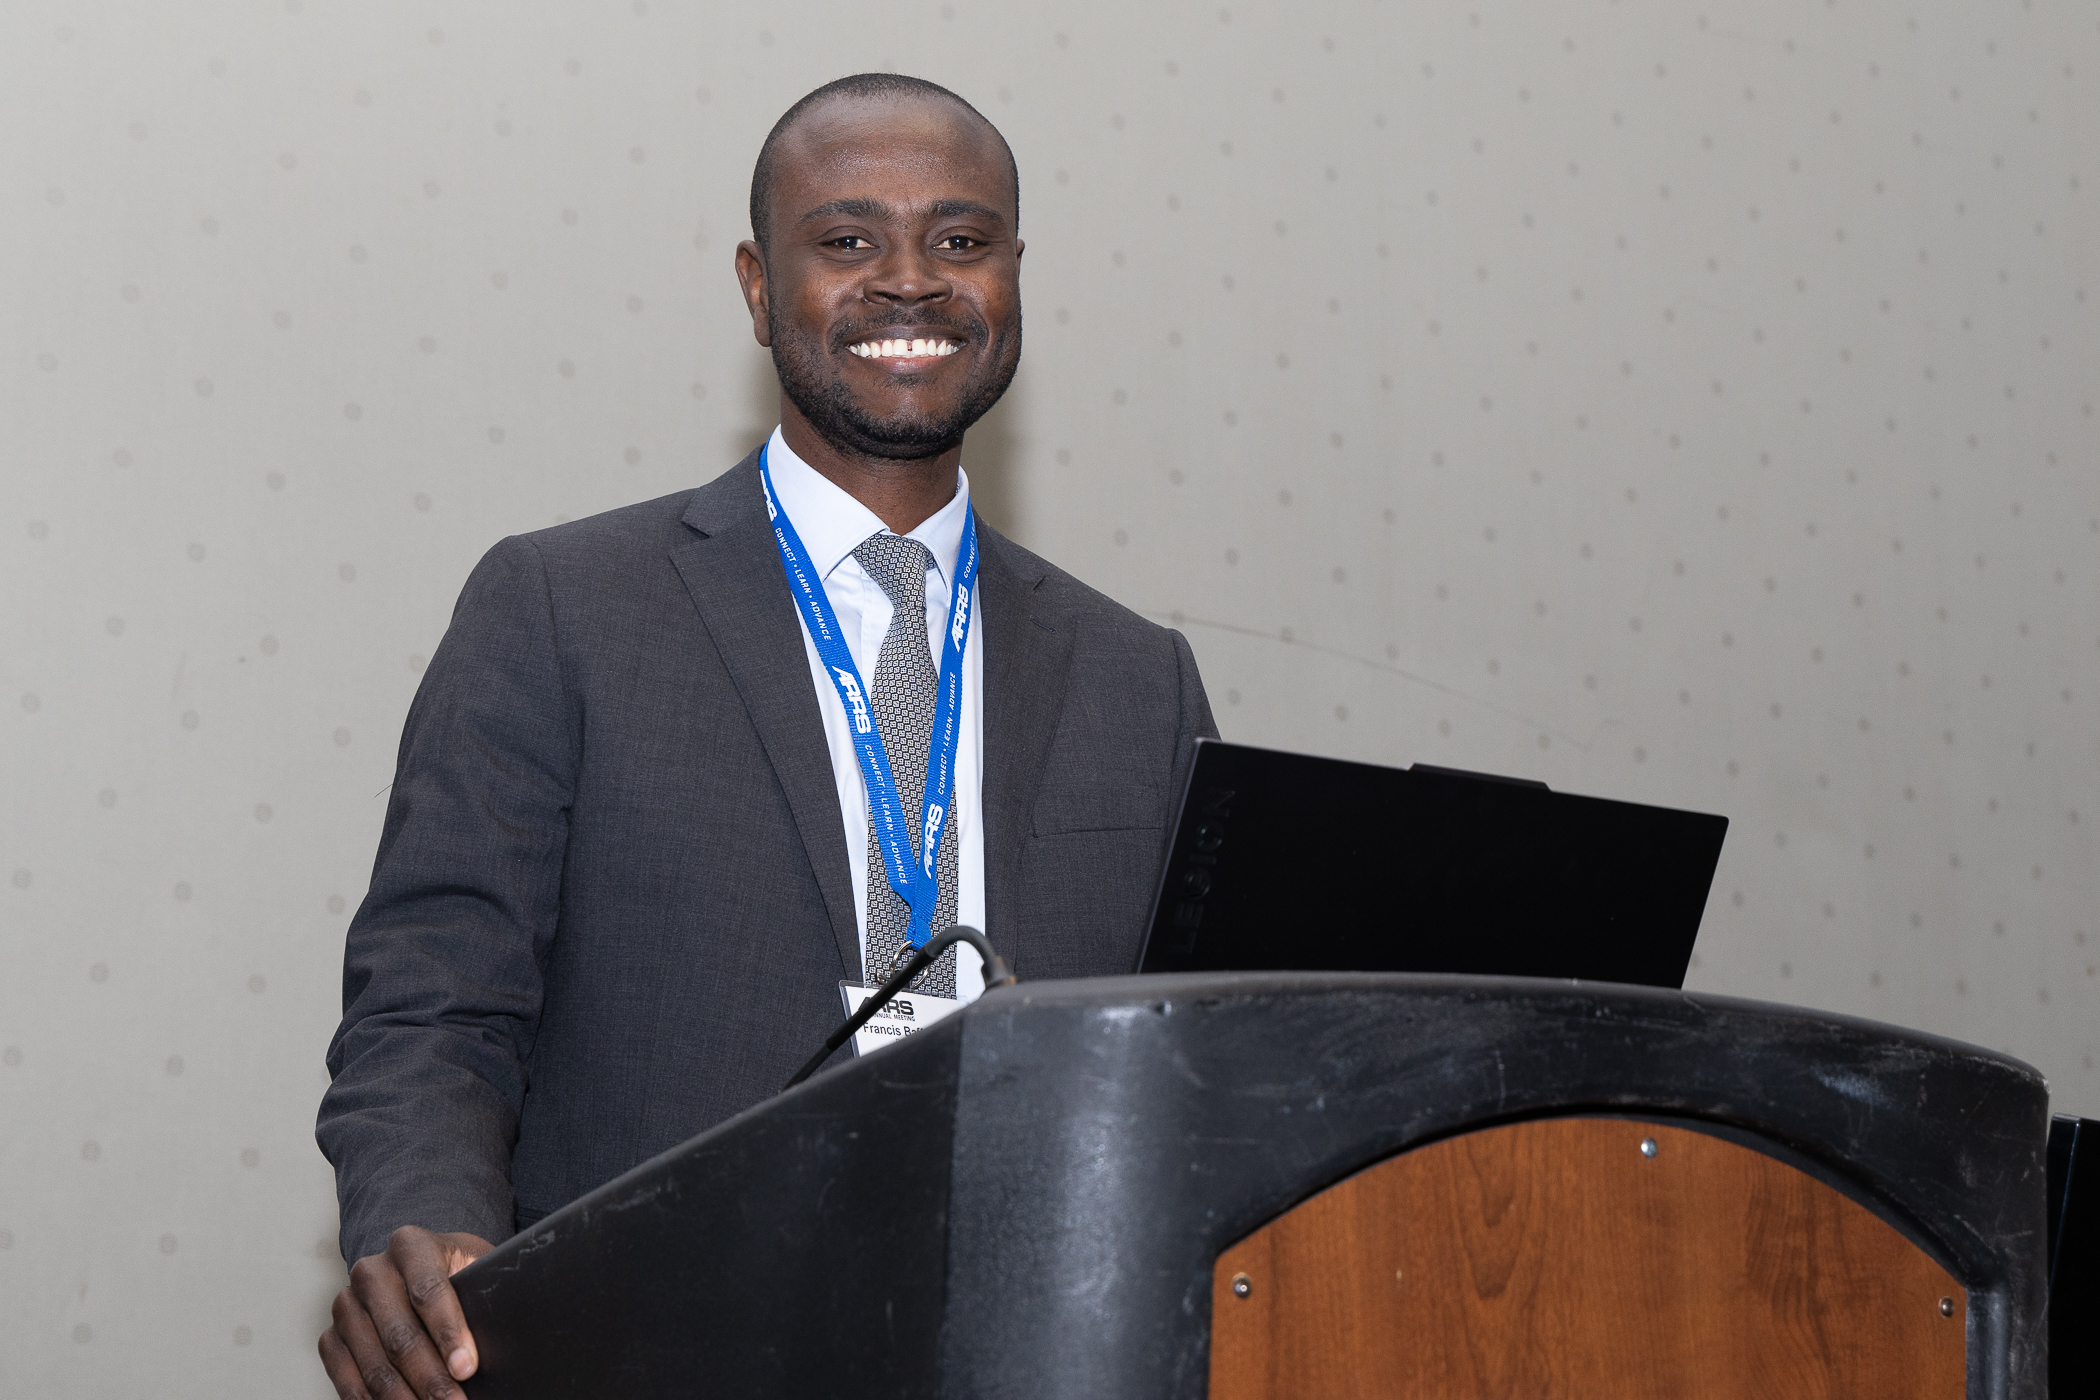
During the American Journal of Roentgenology (AJR) Luncheon on Monday afternoon, Francis Baffour, MD, of Mayo Clinic in Rochester, MN, was honored as the 2024 Melvin M. Figley Fellow in Radiology Journalism, while Hyun Soo Ko, MD,of the Peter MacCallum Cancer Centre and Epworth Medical Imaging in Melbourne, Australiawas recognized as the 2024 Lee F. Rogers International Fellow in Radiology Journalism.
Francis BaffourHyun Soo Ko
Named for two distinguished Editors Emeriti of AJR, the Melvin Figley and Lee Rogers Fellowships offer practicing radiologists an unparalleled opportunity to learn the tenets of medical publishing via “the yellow journal”—the world’s longest continuously published radiology journal. Through hands-on experience with ARRS staff and AJR personnel—as well as personal apprenticeship with AJR’s 13th Editor of Chief, Andrew B. Rosenkrantz—Drs. Baffour and Ko will receive expert instruction in scientific writing and communication, manuscript preparation and editing, peer review processes, journalism ethics, and digital production and publication.
With Distinction: Award-Winning Scientific Research
The 2024 ARRS Annual Meeting hosted hundreds of electronic exhibits and abstracts presenting leading-edge research. Below are three highlights from our 2024 Scientific Program.
Mammograms Reveal Hidden Clues to Heart Health
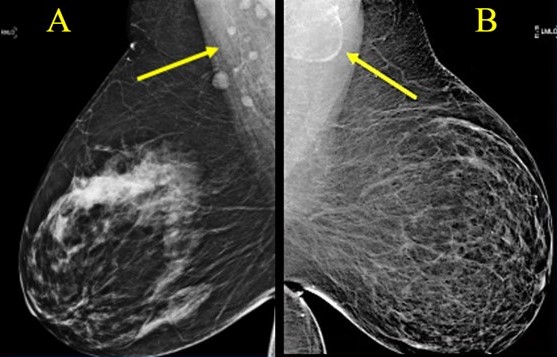
According to the Summa Cum Laude Award-Winning Online Poster presented during the 2024 ARRS Annual Meeting, fat-enlarged axillary nodes on screening mammograms can predict high cardiovascular disease (CVD) risk, Type 2 diabetes (T2DM), and hypertension (HTN).
“Incorporating fat-enlarged nodes into CVD risk models has the potential to improve CVD risk stratification without additional cost or additional testing,” said Jessica Rubino, MD, from Dartmouth Hitchcock Medical Center in Lebanon, NH. “Fat-enlarged axillary lymph nodes visualized on screening mammography may increase the ability to identify women who would benefit from CVD risk reduction strategies and more intensive risk assessment with coronary artery CT.”
Rubino et al. reviewed patients (women, 40–75 years) without known coronary artery disease who had a routine screening mammogram and cardiovascular risk factors available in the EMR within 1 year of the index mammogram (January 1, 2011–December 31, 2012). Evaluating major adverse cardiovascular events (MACE) within 10 years of the index mammogram, the researchers used clinical parameters at the time of the index mammogram to determine high estimated CVD risk via the pooled cohort equation (PCE) —defined by the American Heart Association as more than a 7.5% likelihood of MACE within 10 years. Two breast imagers evaluated screening mammograms to measure the length of the largest visible axillary LN in each breast in the mediolateral oblique view, analyzing the largest visible node for each patient. Logistic regression then examined associations between lymph node size, 10-year CVD risk, MACE, T2DM, HTN, low density lipoprotein (LDL), age, and BMI.
Ultimately, among 1,216 women included in this ARRS Annual Meeting Summa Cum Laude Scientific Poster, 907 (74.6%) had a visible axillary LN on the index mammogram, and 232 (19.1%) women had fat-enlarged nodes—defined as larger than 20 mm in length due to an expanded fatty hilum. Women with fat-enlarged nodes had a high risk of CVD defined by PCE (OR = 2.6, 95% CI 1.5–4.2), as well as a higher prevalence of T2DM (OR = 4, 95% CI 2.1–7.7) and HTN (OR = 2.5, 95% CI 1.6–4.0). Fat-enlarged nodes were also associated with a trend toward higher risk of MACE (OR = 1.7, 95% CI 0.9–3.1) and LDL (OR = 1.4, 95% CI 0.9–2.1).
“These results support further investigation of fat-enlarged lymph nodes,” Rubino added, “particularly with studies leveraging AI evaluation of mammographic fat-enlarged LNs and cardiometabolic disease.”
Fig. 1—Variable LN morphology on screening mammograms in women with obesity due to ectopic fat deposition. A, Normal axillary lymph nodes measuring < 1.5 cm in 63-year-old woman with BM = 43.2. B, Fat-enlarged axillary node with large fatty hilum measuring 4.2 cm in 52-year-old woman with BMI = 45.8.
Detecting Accessory Infraglenoid Muscle in Teres Minor Fatty infiltration
The Magna Cum Laude Award-Winning Online Poster presented during the 2024 ARRS Annual Meeting showed a high prevalence (89%) of accessory infraglenoid muscle (AIGM) in patients with teres minor fatty infiltration (TMFI)—compared to those without (30%). Additionally, within the TMFI cohort, many AIGM abutted the axillary nerve with concomitant axillary neuropathy.
“These results stress the importance of looking for AIGM in the setting of TMFI, as TMFI on preoperative MRI has been associated with poor postsurgical outcomes,” said Jennifer Padwal, MD, from Stanford University Medical Center in California. “And the presence of AIGM on shoulder MRI could negate the need for additional imaging to evaluate the cause of TMFI.”
Padwal et al.’s institutional review of all shoulder MRIs yielded 100 patients with documented TMFI (76 men, 24 women; mean age, 58.6 years). For comparison, a respective sample of 100 shoulder MRIs in patients without TMFI (53 men, 47 women; mean age, 56.4 years) was obtained. All scans were consensus evaluated by two radiologists (one musculoskeletal attending with 25 years of experience, as well as a 4th-year radiology resident) for an AIGM with diagnostic confidence, noting muscle origin and insertion. In patients with TMFI, the distance between the AIGM and axillary nerve was measured, documenting any abnormal axillary nerve signal. TMFI was then graded via Goutallier classification, while the presence of atrophy and/or edema was noted.
Ultimately, in the ARRS Annual Meeting Magna Cum Laude Online Poster, TMFI was grade 1 in 33%, grade 2 in 32%, grade 3 in 13%, and grade 4 in 14%, with intramuscular edema in 33 and atrophy in 21 patients. AIGM was seen in 89/100 patients with TMFI; 30/100 patients without TMFI. In all cases, the AIGM originated from the inferior glenoid neck and inserted onto the humeral neck/proximal humeral diaphysis. The inferior margin of the AIGM in patients with TMFI touched the axillary nerve in 39 (46%), with abnormal signal in 23 (27%) patients.
The Cum Laude Award-Winning Online Poster presented during the 2024 ARRS Annual Meeting found that the noncontrast x-ray pulsatility index (XPI) method to evaluate and monitor pulmonary blood flow could improve clinical efficiency as a screening or diagnostic test, provide substantial financial benefits, and improve patient satisfaction.
“Additionally,” said Matthew Smith, MD, from Vanderbilt University Medical Center in Nashville, TN, “this easy-to-implement method can be performed by an x-ray technologist in an outpatient setting,”
Smith et al. enrolled volunteers suspected of chronic thromboembolic pulmonary hypertension (CTEPH) based on pulmonary scintigraphy and/or CTA. Fluoroscopic acquisition (70 kV, 30 frames/s) over an 8-second breath hold was performed in either RAO (30°) or LAO (40°) for the right and left lung, respectively. The temporal signal from each pixel was decomposed into individual frequency components via Fourier transform. The researchers then isolated heart rate signal oscillation using a band-pass filter and amplitude XPI mapped to form an image. Immediately following each fluoroscopic acquisition for spectral analysis, digital subtraction pulmonary angiography was performed with catheter-injected contrast in the same projection using standard protocols. Perfusion maps were segmented using a blinded manual technique, as well as a semi-automated threshold and region-growing method, while segmentation maps were compared using the Dice similarity coefficient—a statistical measurement of overlap.
Ultimately, in this ARRS Annual Meeting Cum Laude Scientific Poster, where noncontrast (XPI) and contrast pulmonary angiography images were obtained in 11 different lungs, all patients were able to perform satisfactory breath hold, despite moderate to severe disease. Direct comparison of segmentation maps revealed an average Dice score of 0.77, suggesting excellent agreement between XPI and pulmonary angiography maps in depicting regions of blood flow and, more importantly, lack of blood flow.
The American Roentgen Ray Society (ARRS) proudly recognizes four emerging radiologists, as well as their institutions and research projects, with the 2024 ARRS Resident/Fellow in Radiology Awards:
Jessica T. Wen, MD, PhD | Stanford University ARRS Melissa Rosado de Christenson Award “Alpha-Fetoprotein Response Patterns After Y-90 Radioembolization for Intermediate-to-Advanced Hepatocellular Carcinoma Predicts Disease Progression and Survival”
Melina Hosseiny, MD | University of California, San Diego ARRS President’s Award “Multi-task Ensemble Deep Learning for Differential Diagnosis of Pneumonia and Pulmonary Edema on Chest Radiograph”
Ahmed Taher, MD | University of Texas Health Science Center at Houston ARRS Executive Council Award
“Safety and Efficacy of Zilretta Administered to Patients with Greater Trochanteric Bursitis”
Hana L. Haver, MD, MSc | Massachusetts General Hospital
ARRS Executive Council Award “Large Language Models to Assist Breast Imaging Reporting: A Comparison of GPT-3.5 Versus GPT-4 in Assigning BI-RADS Final Assessment Categories”
Supported by The Roentgen Fund®, the ARRS Resident/Fellow in Radiology Awards are available to all ARRS In-Training Members in imaging and allied sciences research to acknowledge their work and present their results during the ARRS Annual Meeting. ARRS Resident/Fellow in Radiology Awards are based on the competence and promise of the candidate in radiological research, education, or administration and the scientific merit and potential impact of the candidate’s research.
Clinician Educator Development Program Supports 30 Radiologists
ARRS CEDP Class of 2024: Sandra Abi Fadel, MD; Kara Alexander, MD; Yashant Aswani, MBBS, MD; Claire Brookmeyer, MD; Joseph Cavallo, MD; Tiffany Chan, MD; Amy Chen, MD; Alyssa Cubbison, DO; Brooke Devenney, MD; Marco Ertreo, MD; Michael George, MD, MFA; Mohammad Ghasemi-Rad, MD; Evguenia Jane Karimova, MD; Michael Kwofie, MD; Edward Lawrence, MD; Brielle Paolini, MD, PhD; Richa Patel, MD; Karen Rodriguez, MD; Asha Sarma, MD; Bindu Setty, MD; Monisha Shetty, MD; Mohammad Shujaat, MD; Elainea Smith, MD; James Stepenosky, DO; Hugo Tames, MD; Sara Tedla, MD; Jooae Choe, MD; Silvina De Luca, MD; Mayra Soares, MD; Patricia Wu, MD
Each year, CEDP recipients are selected to receive a travel grant to attend a specialized workshop during the ARRS Annual Meeting. With a curriculum offering increased proficiency in teaching skills, as well as educational activity design, ARRS’ CEDP remains a highly interactive day of learning. Focusing on new and emerging pedagogical tools, while improving already acquired clinical acumen, over half of this expertly curated syllabus consisted of hands-on learning.
Offering a unique opportunity to interact with fellow enthusiastic clinician educators the Saturday before the meeting begins, attendees engaged further with the esteemed faculty ARRS convened: 2024 Distinguished Educator, David M. Naeger, MD; longtime CEDP instructors Judith A. Gadde, DO, and Travis S. Henry, MD, first-time CEDP leader Sherry Wang, MD; as well as the 2021 AJR Melvin M. Figley Fellow in Radiology Journalism, Omer A. Awan, MD.
Chairpersons and program directors at medical schools, affiliated hospitals, and clinical research institutions are invited to nominate two candidates per institution for the 2025 ARRS Clinician Educator Development Program. For full details, please visit ARRS.org/CEDP.
Honorary Lectures Hone In On Cardiothoracic Interpretation, Chest Radiography
On Monday, May 6, and Tuesday, May 7, Ballroom A of John B. Hynes Veterans Memorial Convention Center in Boston witnessed not one, but two must-see Roentgen Fund Honorary Lectures.
Former Roentgen Fund chair Melissa Rosado de Christenson, MD, sponsored and helped to deliver “Great Cardiothoracic Interpretations From Our Practices.” Presented in memory of Robert D. Pugatch, MD, Dr. Rosado de Christenson, was joined by Drs. Jeffrey Klein and Caroline Chiles. These three luminaries of chest imaging—all past presidents of the Society of Thoracic Radiology—discussed the great cases that they have seen in their own clinical practices.
In honor of Drs. Rosado de Christenson and Gerald Abbott, 2024 ARRS Gold Medalist Philip Costello, MD, graciously underwrote “Chest Radiography: Pearls from the Experts.” A high-profile presentation in four high-impact parts, Dr. Abbott, himself, opened, pointing out pearls and pitfalls alike when interpreting chest radiographs. Saurabh Agarwal’s presentation on focal lung disease followed, with Tami J. Bang offering a much need primer for cardiac devices. The last session of this year’s slate of Honorary Lectures concluded with Ioannis Vlahos’ guidance regarding dual-energy chest radiographs.
Since 1990, The Roentgen Fund has granted millions of dollars to hundreds of imaging professionals for both research pursuits and professional development. Today, through six vital scholarship and fellowship programs, the generosity of The Roentgen Fund’s donors is channeled to every corner of the globe—establishing dual foundations in innovation and leadership for a true diversity of radiology’s next generation.
The Roentgen Fund Honorary Lecture offers donors a prestigious opportunity to honor a mentor, recognize a colleague, or remember a loved one in a high-level manner during the ARRS Annual Meeting. At the same time, these generous donors support scholarships and awards to invest in the future of radiology.
Presently, burnout is included in the World Health Organization’s (WHO) 11th Revision of the International Classification of Diseases (ICD-11)—as an occupational phenomenon, however.
Burnout is not classified as a medical condition.
In the WHO’s chapter on factors influencing health status or contact with health services, the agency includes reasons for which people contact health services that are not classed as illnesses or health conditions.
Depersonalization, feelings of cynicism, negativity;
Reduced professional efficacy.
Burnout During Residency Training: A Literature Review
Distress during medical school and residency can lead to burnout—which, in turn, can result in negative consequences as a working physician. Prevalent in medical students (28%–45%), residents (27%–75%, though specialty dependent), and in practicing physicians (63%), burnout’s psychological distress and physical symptoms impact both work performance and patient safety. Specific contributors of said burnout include the following: time demands, lack of control, work planning and organization, as well as inherently difficult job situations and interpersonal relationships.
Fortunately, there are several workplace interventions for mentors to mitigate burnout with in-training physicians, such as wellness workshops, workload modifications (e.g., increased diversity of work duties), and better stress management education or appropriate emotional intelligence training.
As individuals, we have our own behavioral interventions to make: meditation, counseling, etc. Social interventions matter, too, especially when promoting our professional relationships. We can’t forget the importance of exercise and other physical activity either.
If not addressed, the risks of burnout are myriad. In addition to increased cardiovascular disease and inflammatory biomarkers, burnout elevates rates of depression and suicidal ideation. Thankfully, plans and attempts in burnout states do tend to decline with recovery.
Importantly, clinician depersonalization is associated with lower patient satisfaction and longer post discharge patient recovery time. So, we need to be able to identify elements of burnout—in ourselves and in others.
I am proud, deeply honored, and flattered to have served as the 123rd president of the American Roentgen Ray Society (ARRS). As you know, ARRS is the oldest radiology society, and we are widely regarded as the education society.
Health care and radiology are in the midst of unprecedented change, in part, due to the after effects of the COVID pandemic and the resultant Great Resignation, including what will probably be permanent alterations in the workforce. There is unprecedented “consumerism” in medicine with a mandate to improve patient access and to have transparent pricing. There has been a shortage of radiologists fueled, in part, by a desire to be part-time, a trend toward exclusive subspecialization, ever-increasing expectation for service to our hospitals and health care systems, and decreasing reimbursement. There is a concern about what role artificial intelligence and machine learning might play.
Despite all the changes in our professional environments, ARRS has and will double down on its commitment to provide a professional home and outstanding, trusted educational resources for all our members—ranging from those in-training seeking preparation for the new oral boards examination, to those in practice desiring trusted continuing education, and to those in academic departments educating the next generation and contributing to cutting-edge clinical research. The ARRS strives to connect with radiologists at our Annual Meeting and through the American Journal of Roentgenology (AJR), online symposia, live webinars, as well as other books and publications.
In my view, the future for radiology and for ARRS is bright and exciting. During my career, there has been explosive growth in advanced imaging technology with concomitant development of new diagnostic approaches and image-guided interventions and therapies. Radiology expertise is more critical than ever before in working with our clinical colleagues to screen, diagnose, treat, and care for our patients. At the same time, there is an opportunity to respond to the unprecedented pressure to be more efficient, while ensuring appropriateness, safety, and positive outcomes.
Radiology continues to attract the brightest medical students, reflected in the reality that there are more students interested in radiology than currently available training slots. Our residency and fellowship training programs continue to evolve and improve. The job market is robust for radiologists, and there are plenty of excellent opportunities for radiologists in our various communities.
Thank you for allowing me to serve as your ARRS president this last year. I would also like to thank the members of the ARRS Executive Council, particularly Executive Committee members: President-elect Angelisa Paladin, Vice President Deb Baumgarten, and Secretary/Treasurer Christine Glastonbury. Special thanks to Susan Cappitelli, ARRS Executive Director, too.
I look forward to connecting with many of you during our upcoming Annual Meeting in Boston, MA, May 5–9, 2024.
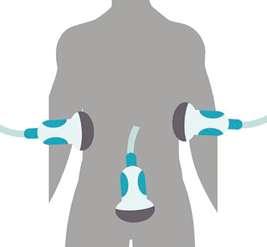
Point-of-care ultrasound (POCUS) is a focused ultrasound (US) examination performed and interpreted by the clinician at the patient’s bedside to answer a specific clinical question or guide an invasive procedure. Because the clinician can correlate findings with a patient’s signs and symptoms, POCUS can provide valuable diagnostic information to narrow the differential and guide management in real time [1, 2]. Integration of POCUS into clinical practice has been shown to increase diagnostic accuracy and expedite time to diagnosis and treatment, as well as reduce costs and length of stay and improve patient safety and satisfaction [3–8].
POCUS examinations are focused and operator-dependent; therefore, they tend to provide limited information. As such, POCUS does not replace comprehensive radiologist-performed diagnostic studies; CT is overall superior in evaluating patients with an acute abdomen (i.e., sudden onset of severe abdominal pain) [1, 8]. However, because POCUS is portable, noninvasive, radiation-free, and easily repeatable, it is especially valuable in high-acuity settings, where expedient answers and patient stability are a consideration. POCUS may not be the best definitive test, but it is an excellent initial diagnostic tool that can aid in critical decision-making [9]. The scope of POCUS has expanded significantly in recent decades to include a myriad of applications. Among these are targeted evaluations of acute intraabdominal pathology, where rapid recognition and prompt management are key. This includes hemoperitoneum, ectopic pregnancy, abdominal aortic aneurysm (AAA), obstructive uropathy, appendicitis, bowel obstruction, and pneumoperitoneum [9, 10]. This InPractice article provides an overview of the scope and utility of POCUS for the acute abdomen, focusing on commonly used applications in clinical practice.
Free Fluid
Intraperitoneal free fluid is the pathologic accumulation of fluid within the peritoneal cavity. This can result from various disease processes, including traumatic hemorrhage, ruptured ectopic pregnancy, AAA, bowel perforation or obstruction, and ascites. Although many of these pathologies usually warrant additional diagnostic imaging, POCUS is a valuable initial test that can quickly detect free fluid, which can influence workup and management [11].
Free Fluid in Trauma Setting
Evaluating intraperitoneal free fluid in the setting of trauma is among the most well-established uses of POCUS. First described in Europe in the 1970s and adopted in the United States by the 1990s, this examination is now known as “focused assessment with sonography in trauma” (FAST) [12]. The FAST examination includes a quick survey of key areas in the intraperitoneal cavity for free fluid, a sign of hemorrhage, and an indirect indication of organ injury; cardiac and thoracic components are also included. The abdominal component of FAST evaluates the right and left upper quadrants, focusing on the perihepatic and perisplenic spaces, respectively, along with the pelvis [11, 12] (Fig. 1).
Fig. 1—Abdominal focused assessment with sonography in trauma (FAST) examination includes right and left upper quadrant and pelvis.
The sensitivity and specificity of FAST for detecting intraperitoneal free fluid is 64–98% and 86–100%, respectively [13]. Though not perfect, FAST has greater accuracy compared with physical examination, laboratory tests, and radiography to detect intraabdominal injury. In hemodynamically unstable patients, the diagnostic accuracy increases significantly [14]. Because of its utility, the FAST examination has become the initial screening modality (replacing the previous standard of diagnostic peritoneal lavage) at most trauma centers nationwide and is included in the Advanced Trauma Life Support protocol [15]. A FAST examination is primarily indicated in the setting of blunt trauma but can help triage and prioritize further diagnostic testing and management in cases of penetrating abdominal trauma. A positive FAST—that is, the presence of free fluid—suggests an intraabdominal injury, whereas a negative FAST alone does not obviate additional testing for intraabdominal injury. This is because a FAST examination cannot reliably rule out injuries to solid or hollow organs [13].
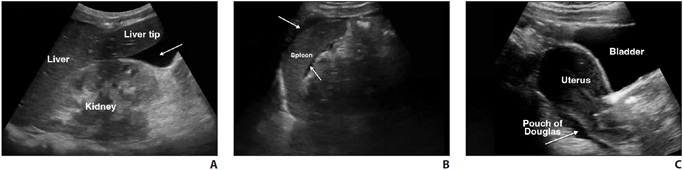
The amount of free fluid detected at a specific point in time depends on the rate of accumulation, location, and the patient’s position [9]. Free fluid gravitates to the most dependent area, which is the right upper quadrant (RUQ) in a supine patient [16]. Within the RUQ, the hepatorenal recess (also known as Morison pouch) is a common area of interest; however, the caudal tip of the liver is where fluid tends to collect first. In the left upper quadrant, attention should be directed to the perisplenic area, particularly in the subdiaphragmatic space. In the pelvis, fluid tends to collect posterior to the uterus, known as the pouch of Douglas, in females and in the rectovesicular space or lateral to the bladder in males [17] (Fig. 2).
Fig. 2—POCUS evaluation of free fluid on focused assessment with sonography in trauma (FAST) views. A–C, Images show free fluid (arrows) in right (A) and left (B) upper quadrant and pelvis (C).
Despite its recognized utility, the FAST examination has several limitations. In addition to inability to exclude organ injury, it can also be limited by other factors, including operator experience, body habitus, and bowel gas. Free fluid can have varying appearances depending on the type and composition of fluid, and it can change over time. For example, blood is initially anechoic or black, but blood becomes more echogenic as it clots, which makes it difficult to identify and distinguish free fluid from surrounding organs, fat, or other structures. US cannot differentiate the type of fluid (i.e., blood, urine, ascites) and is unable to detect retroperitoneal hemorrhage [11, 12].
Free Fluid in Nontrauma Setting
The FAST examination is highly valuable when evaluating free fluid from nontraumatic hemoperitoneum (such as from ruptured ectopic pregnancy), bowel perforation or obstruction, ascites, and undifferentiated hypotension [11]. When evaluating or managing a patient with ascites, POCUS allows for quantification and distribution of the fluid and can provide real-time procedural guidance for paracentesis at the bedside, which improves success and reduces complications [3]. The other topics are covered separately in the subsequent sections.
Ectopic Pregnancy
Ectopic pregnancy is the leading cause of maternal mortality in the first trimester, and prompt recognition is key [18, 19]. US is the primary imaging modality throughout pregnancy, and the main goals of POCUS, especially in the first trimester, are to identify an intrauterine pregnancy (IUP) and evaluate for free fluid. Confirming an IUP essentially excludes ectopic pregnancy, whereas the absence of an IUP should raise concern for an ectopic pregnancy, especially if the patient has concerning signs or symptoms. Though not a goal of POCUS, it is possible to identify an extrauterine gestational sac containing a yolk sac or fetal pole, which is diagnostic of ectopic pregnancy. Additional nonspecific findings that may also be seen include a complex mass, tubal ring, and free fluid, but their absence does not rule out ectopic pregnancy [11].
In the setting of known or suspected ectopic pregnancy, free fluid in the RUQ is highly concerning for rupture, which can be life-threatening. This finding not only predicts the need for operative intervention, but it significantly expedites the time to diagnosis and definitive management [18–20].
Abdominal Aortic Aneurysm
AAA is a relatively common acute abdominal process with high mortality. A ruptured AAA requires rapid diagnosis and prompt surgical intervention. Clinicians often rely on classic signs and symptoms, including severe abdominal or back pain, syncope, hypotension, or a pulsatile abdominal mass, but these have poor sensitivity [21]. CTA is the preferred imaging study for ruptured AAA, and US is a well-established and validated screening modality [22].
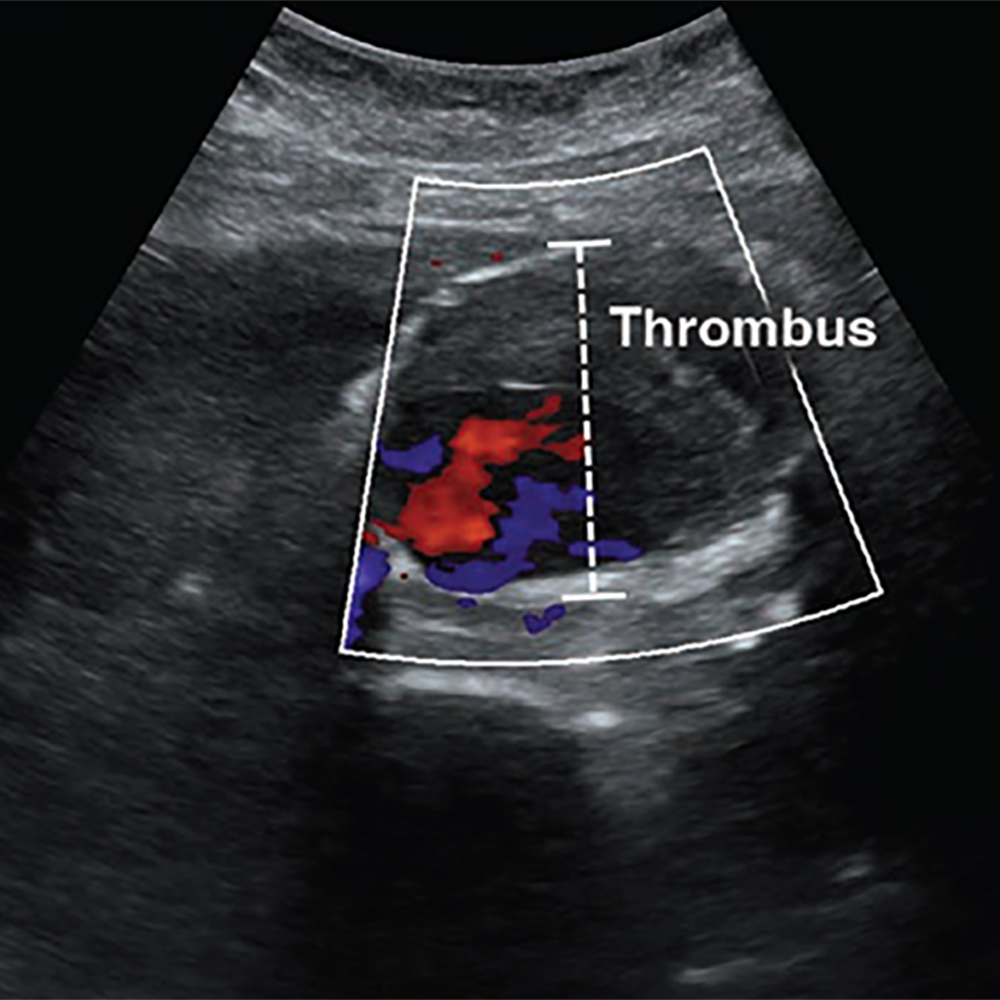
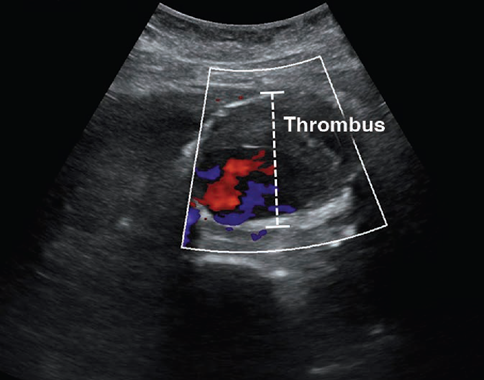
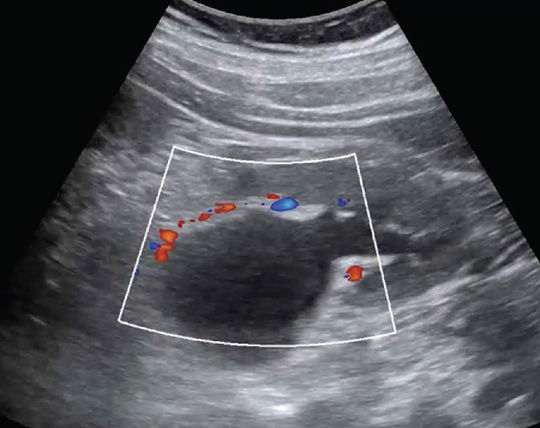
POCUS has excellent ability to detect AAA, which is defined by a diameter exceeding 3 cm when measured from outer wall to outer wall (Fig. 3).
Fig. 3—POCUS image shows abdominal aortic aneurysm with intraluminal thrombus. Correct diameter measurement is outer wall to outer wall in anterior-posterior fashion (dashed line).
A systematic review and meta-analysis found POCUS to have a sensitivity of 99% and specificity of 98%, when performed by emergency medicine physicians [23]. Although POCUS can accurately determine the presence or absence of AAA, the ability to detect signs of rupture is poor, which is largely due to the limited ability to visualize the retroperitoneum. Findings that indicate rupture include deformation of aneurysmal shape, heterogeneity or focal discontinuity of the intraluminal thrombus, focal disruption of the outer wall, hypoechoic areas in the paraaortic region, and hemoperitoneum [24].
POCUS is a great initial imaging option for suspected AAA, especially in the emergency department (ED), but adequate visualization may be limited by body habitus or bowel gas. The latter can be mitigated by graded compression, whereby slow, sustained pressure is applied to the abdomen to displace loops of bowel (and associated intraluminal gas) to allow better visualization of underlying structures. Like the FAST examination, AAA assessment is one of the core POCUS applications and is a required part of residency training for nonradiology specialties [10].
Cholelithiasis and Cholecystitis
Cholelithiasis and cholecystitis are common biliary pathologies characterized by gallstones in the gallbladder and inflammation of the gallbladder, respectively. US is the reference standard for diagnosis. Biliary POCUS is well established for identifying cholelithiasis or cholecystitis [10].
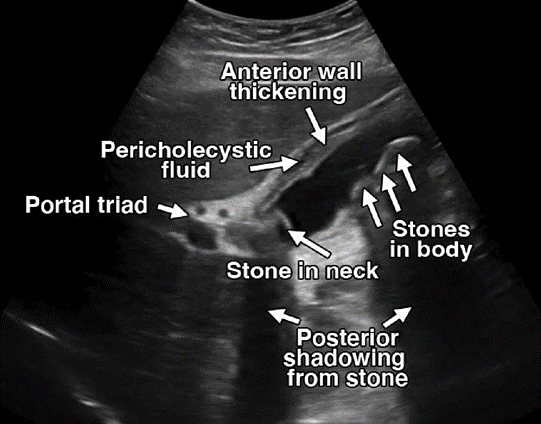
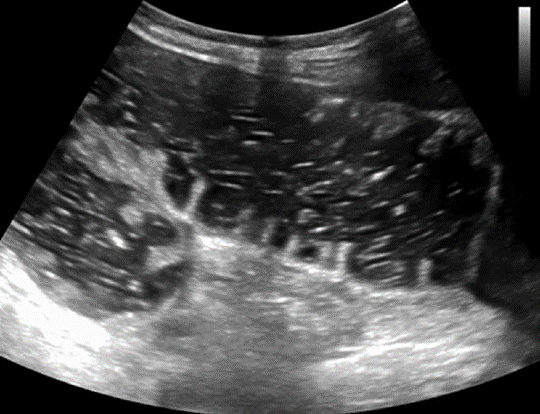
Sonographically, gallstones typically appear as a hyperechoic structure with distinct posterior shadowing. Imaging findings of cholecystitis include thickened gallbladder wall, pericholecystic fluid, and sonographic Murphy sign, in addition to sludge or gallstones in most cases [11] (Fig. 4).
Fig. 4—POCUS shows multiple gallstones (including one in neck of gallbladder), pericholecystic fluid, and wall thickening, indicating cholecystitis.
Like other abdominal POCUS examinations, body habitus and bowel gas can be limiting. For the latter, having the patient sit upright or move into a left lateral decubitus position can often help move the bowel loops away from the gallbladder to improve visualization. Additional pitfalls include misidentification of anatomy or mistaking normal physiologic changes with pathologic findings, such as a contracted gallbladder [11, 25].
Despite these limitations, emergency physician–performed POCUS for cholelithiasis and cholecystitis has sensitivity and specificity comparable to that of radiologist-performed US [25, 26]. Biliary POCUS alone has been shown to reliably inform surgical decision-making and can reduce length of stay in the ED [27, 28]; however, routine adoption in clinical practice has been limited. Although POCUS does not replace comprehensive imaging, it is a safe, efficient, and reliable diagnostic option for cholelithiasis and cholecystitis.
Obstructive Uropathy
Obstructive uropathy can result from intrinsic or extrinsic obstruction of the urinary tract system and can be unilateral or bilateral, depending on the etiology. Renal colic commonly results from nephrolithiasis, which can lead to hydronephrosis when obstruction occurs. CT is the preferred imaging study for suspected nephrolithiasis, but POCUS is appropriate for initial imaging examination [11].
The focus of renal POCUS is to detect signs of obstruction (i.e., hydronephrosis and urinary retention) rather than identifying the stone, itself. POCUS is less sensitive, but more specific for nephrolithiasis compared with CT and has test characteristics comparable to those of traditional US. Use of POCUS is associated with shorter length of stay in the ED [29]. POCUS is highly specific for nephrolithiasis with moderate hydronephrosis, but less accurate in cases of mild or no hydronephrosis [30] (Fig. 5).
Fig. 5—Doppler US image shows significant dilation of renal pelvis extending peripherally into calices, consistent with hydronephrosis. Lack of color flow differentiates hydronephrosis from prominent renal vasculature.
Advanced signs of obstruction are associated with larger stones, which often require surgical intervention, rather than conservative management [31]. For younger patients in whom uncomplicated renal colic is suspected, POCUS is a favorable initial imaging modality and perhaps the only imaging study needed. In patients with less typical signs and symptoms, POCUS can influence clinical suspicion and help inform the need for further imaging [32].
Appendicitis
Appendicitis is the most common surgical emergency worldwide and can be complicated by perforation, which occurs in approximately 20% of cases [33]. Along with clinical and laboratory findings, multiple imaging studies play a role in diagnosing appendicitis. CT may be the most accurate, but radiologist-performed US is well established and especially favorable in children in whom radiation exposure is a concern [34, 35]. POCUS has emerged as a promising diagnostic tool with relatively high sensitivity and specificity for appendicitis [34].
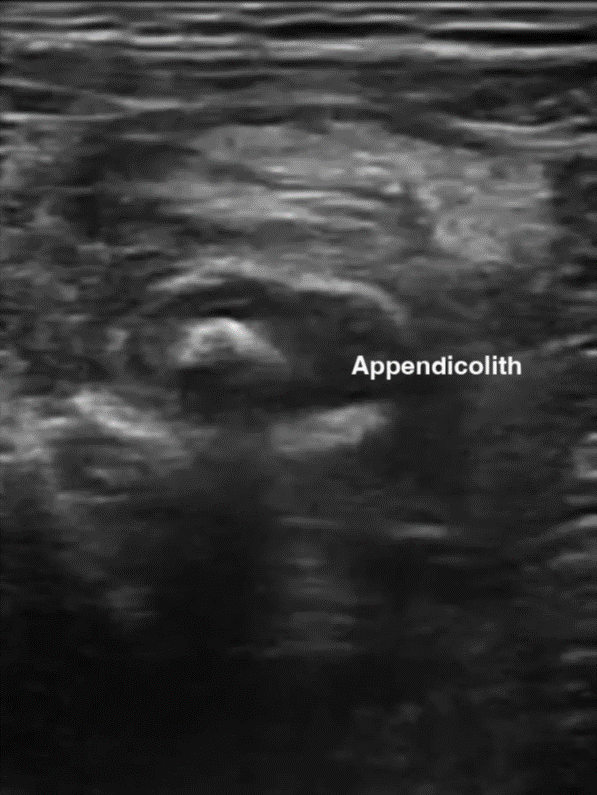
Characteristic sonographic findings include target sign in the short axis, blind-ended pouch in the long axis, lack of compressibility, diameter greater than 6 mm, wall thickness greater than 3 mm, appendicolith, and hypervascularity. Indirect findings suggestive of appendicitis include periappendiceal free fluid or abscess, hyperechoic mesenteric fat, enlarged mesenteric lymph nodes, increased peritoneal thickness, and signs of small bowel obstruction (SBO) [35] (Fig. 6).
Fig. 6—Appendicitis findings on point-of-care ultrasound. Left and Right, Longitudinal images show blind-ended pouch (Left) and periappendiceal fluid with appendicolith (Right).
Benefits of POCUS examination include lack of radiation exposure, lower costs, and ability to help prioritize radiology studies or expedite surgical consult. It may be particularly useful in centers where radiologist-performed US is not continually available. Visualizing the appendix is often limited by body habitus, pain, retrocecal location, and operator skill and experience. In addition, because a normal appendix is often difficult to visualize, this may be a more challenging POCUS study to learn [9, 34]. POCUS is a promising adjunct diagnostic tool, but it has not been extensively studied as a stand-alone test for appendicitis [34].
Bowel Obstruction
Bowel obstruction is a common acute abdominal process that needs timely diagnosis and management to avoid complications, such as ischemia, perforation, and necrosis. Obstruction is defined by impaired flow of bowel contents with varying degrees, ranging from partial to complete obstruction [36]. CT is commonly used to diagnose SBO but can be time-consuming, expensive, and involve radiation exposure. Radiography is often used as an initial imaging study, but sensitivity and specificity are poor and outperformed by POCUS [37]. A systematic review and meta-analysis found POCUS to have a high sensitivity and specificity for diagnosing SBO, rivaling that of CT, with the added benefit of saving time and potentially radiation [38]. The high diagnostic accuracy of POCUS is primarily for complete obstructions; POCUS is less reliable for partial obstruction [39]. Like other POCUS applications, evaluating SBO is highly operator-dependent. Although it may be easy to learn and demonstrate competency, US fellowship training is associated with significantly increased diagnostic accuracy [37–40].
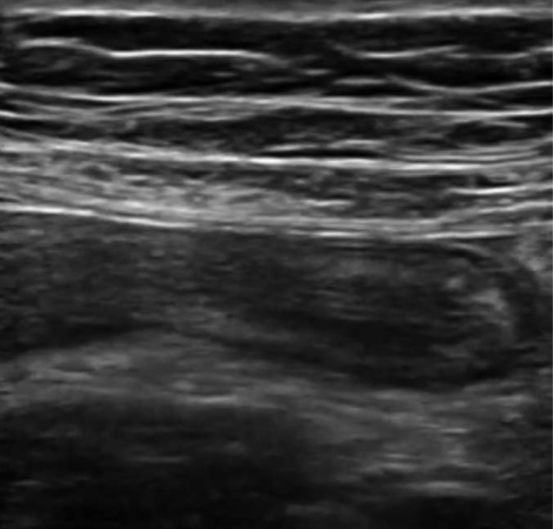
Sonographic findings of SBO include dilated bowel with a diameter of greater than 2.5 cm, fluid-filled loops of bowel, decreased peristaltic movement, increased wall thickness, prominent valvulae conniventes, and a collapsed colonic lumen [40, 41] (Fig. 7).
Fig. 7—Small bowel obstruction with dilated, fluid-filled bowel and prominent valvulae conniventes.
Free fluid in the peritoneal cavity is associated with higher-grade obstruction and predicts need for operative intervention [42]. A transition point is often difficult to visualize, but POCUS can locate and identify the potential cause of obstruction, such as hernia, intussusception, masses, and signs of ischemia [43]. Evaluating SBO is not a core application of POCUS; it is a suitable modality for initial imaging evaluation and early management of SBO.
Pneumoperitoneum
Pneumoperitoneum is free air in the peritoneal cavity [44]. Free air suggests perforation of a hollow viscus organ, which can result from weakening of the bowel wall, ischemia, foreign body, bowel obstruction, or infection and has high morbidity and mortality [45]. CT is the imaging study of choice. Radiography is often used as an initial diagnostic study for pneumoperitoneum, but sensitivity is generally poor, especially when the amount of air is small. An upright lateral view has greater sensitivity compared with posterior-anterior or supine views, but this is not always possible, especially in critically ill patients [45, 46]. POCUS has proven value as an initial diagnostic test that can expedite recognition and timely management of pneumoperitoneum [44, 47]. US cannot identify the site or extent of perforation like CT, but POCUS has greater sensitivity than radiography with comparable specificity and PPV [48].
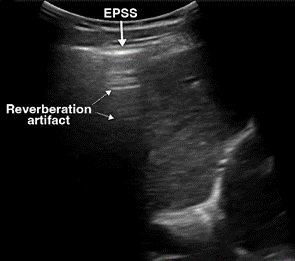
On US, free air is evaluated by focusing on the least dependent areas in the peritoneal cavity, where the air tends to migrate. In a supine patient, air moves anteriorly toward the interface between the peritoneal cavity and anterior abdominal wall and is often best identified in the RUQ over the liver [9, 49]. The highly reflective surface of air produces increased echogenicity of the peritoneal line, which is referred to as the enhanced peritoneal stripe sign. Often accompanying this is reverberation artifact, consisting of repeating hyperechoic horizontal lines directly below the enhanced peritoneal line. “Dirty” shadowing may be seen, obscuring the underlying organs (Fig. 8A). Because air can move freely within the peritoneal cavity, these findings change with patient position, known as shifting phenomenon [9, 47, 49]. Similarly, the scissors maneuver can help detect free air and visualize its movement. This technique consists of applying pressure with the probe over the liver to displace the free air and associated artifacts, making these findings less prominent. When the compression is released, the free air returns and associated artifacts become visible again [50].
An important potential pitfall is mistaking free air for intraluminal bowel gas. To differentiate between the two, it helps to focus on the hepatic region where bowel gas is minimal and consider position change or compression to help further identify pneumoperitoneum. Free air moves independent of respiration and peristalsis, unlike intraluminal air in the bowel [9, 47].
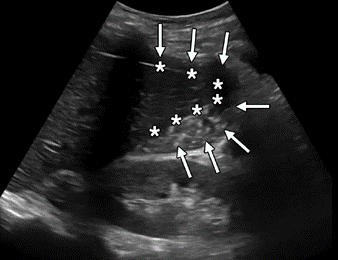
Gastric contents in the peritoneal cavity may accompany pneumoperitoneum in cases of bowel perforation. On US, this will appear as free fluid with echogenic debris in the dependent areas of the abdomen [9, 47, 49] (Fig. 8).
Fig. 8—Evaluation of free air on POCUS. Left, Image shows pneumoperitoneum with free air over liver, characterized by enhanced peritoneal stripe sign (EPSS) (solid arrow) and reverberation artifacts (dotted arrows). Right, Image shows free fluid with echogenic gastric contents (arrows) in peritoneal cavity at liver tip (asterisks), indicating bowel perforation.
POCUS is a valuable diagnostic tool that can be applied at the bedside to quickly answer focused clinical questions. With a broad and continually expanding scope, POCUS is used by many specialties and is incorporated in medical education and training. Although POCUS does not replace comprehensive imaging in patients with an acute abdomen, it has value as an initial imaging modality that can rapidly provide key diagnostic information. POCUS can influence clinical suspicion, guide decision-making, and expedite the diagnosis and treatment by enabling providers to correlate clinical and imaging findings with the patient in real time.
References
Moore CL, Copel JA. Point-of-care ultrasonography. N Engl J Med 2011; 364:749–757
Jang T, Chauhan V, Cundiff C, Kaji AH. Assessment of emergency physician-performed ultrasound in evaluating nonspecific abdominal pain. Am J Emerg Med 2014; 32:457–460
Peabody CR, Mandavia D. Deep needle procedures: improving safety with ultrasound visualization. J Patient Saf 2017; 13:103–108
Roxas R, Gallegos L, Bailitz J. Rapid detection of aortic occlusion with emergency ultrasonography. Ann Emerg Med 2011; 58:21–23
Lindelius A, Torngren S, Nilsson L, Pettersson H, Adami J. Randomized clinical trial of bedside ultrasound among patients with abdominal pain in the emergency department: impact on patient satisfaction and health care consumption. Scand J Trauma Resusc Emerg Med 2009; 17:60
Howard ZD, Noble VE, Marill KA, et al. Bedside ultrasound maximizes patient satisfaction. J Emerg Med 2014; 46:46–53
Durgun Y, Yurumez Y, Guner NG, Aslan N, Durmus E, Kahraman Y. Abdominal pain management and point-of-care ultrasound in the emergency department: a randomised, prospective, controlled study. J Coll Physicians Surg Pak 2022; 32:1260–1265
Laméris W, van Randen A, van Es HW, et al. Imaging strategies for detection of urgent conditions in patients with acute abdominal pain: diagnostic accuracy study. BMJ 2009; 338:b2431
Abu-Zidan FM, Cevik AA. Diagnostic point-of-care ultrasound (POCUS) for gastrointestinal pathology: state of the art from basics to advanced. World J Emerg Surg 2018; 13:47
[No authors listed]. Ultrasound guidelines: emergency, point-of-care and clinical ultrasound guidelines in medicine. Ann Emerg Med 2017; 69:e27–e54
Ma O, Mateer JR, Reardon RF, Joing SA, eds. Ma and Mateer’s emergency ultrasound, 3rd ed. McGraw Hill, 2014
Bloom BA, Gibbons RC. Focused assessment with sonography for trauma. StatPearls Publishing, 2023
Körner M, Krötz MM, Degenhart C, Pfeifer KJ, Reiser MF, Linsenmaier U. Current role of emergency US in patients with major trauma. RadioGraphics 2008; 28:225–242
Nishijima DK, Simel DL, Wisner DH, Holmes JF. Does this adult patient have a blunt intra-abdominal injury? JAMA 2012; 307:1517–1527
Boulanger BR, Kearney PA, Brenneman FD, Tsuei B, Ochoa J. Utilization of FAST (focused assessment with sonography for trauma) in 1999: results of a survey of North American trauma centers. Am Surg 2000; 66:1049–1055
Rozycki GS, Ochsner MG, Feliciano DV, et al. Early detection of hemoperitoneum by ultrasound examination of the right upper quadrant: a multicenter study. J Trauma 1998; 45:878–883
Lobo V, Hunter-Behrend M, Cullnan E, et al. Caudal edge of the liver in the right upper quadrant (RUQ) view is the most sensitive area for free fluid on the FAST exam. West J Emerg Med 2017; 18:270–280
Rodgerson JD, Heegaard WG, Plummer D, Hicks J, Clinton J, Sterner S. Emergency department right upper quadrant ultrasound is associated with a reduced time to diagnosis and treatment of ruptured ectopic pregnancies. Acad Emerg Med 2001; 8:331–336
Moore C, Todd WM, O’Brien E, Lin H. Free fluid in Morison’s pouch on bedside ultrasound predicts need for operative intervention in suspected ectopic pregnancy. Acad Emerg Med 2007; 14:755–758
Stone BS, Muruganandan KM, Tonelli MM, Dugas JN, Verriet IE, Pare JR. Impact of point-of-care ultrasound on treatment time for ectopic pregnancy. Am J Emerg Med 2021; 49:226–232
Fernando SM, Tran A, Cheng W, et al. Accuracy of presenting symptoms, physical examination, and imaging for diagnosis of ruptured abdominal aortic aneurysm: systematic review and meta-analysis. Acad Emerg Med 2022; 29:486–496
Lindholt JS, Vammen S, Juul S, Henneberg EW, Fasting H. The validity of ultrasonographic scanning as screening method for abdominal aortic aneurysm. Eur J Vasc Endovasc Surg 1999; 17:472–475
Rubano E, Mehta N, Caputo W, Paladino L, Sinert R. Systematic review: emergency department bedside ultrasonography for diagnosing suspected abdominal aortic aneurysm. Acad Emerg Med 2013; 20:128–138
Catalano O, Siani A. Ruptured abdominal aortic aneurysm: categorization of sonographic findings and report of 3 new signs. J Ultrasound Med 2005; 24:1077–1083
Ross M, Brown M, McLaughlin K, et al. Emergency physician-performed ultrasound to diagnose cholelithiasis: a systematic review. Acad Emerg Med 2011; 18:227–235
Summers SM, Scruggs W, Menchine MD, et al. A prospective evaluation of emergency department bedside ultrasonography for the detection of acute cholecystitis. Ann Emerg Med 2010; 56:114–122
Hilsden R, Mitrou N, Hawel J, Leeper R, Thompson D, Myslik F. Point of care biliary ultrasound in the emergency department (BUSED) predicts final surgical management decisions. Trauma Surg Acute Care Open 2022; 7:e000944
Blaivas M, Harwood RA, Lambert MJ. Decreasing length of stay with emergency ultrasound examination of the gallbladder. Acad Emerg Med 1999; 6:1020–1023
Smith-Bindman R, Aubin C, Bailitz J, et al. Ultrasonography versus computed tomography for suspected nephrolithiasis. N Engl J Med 2014; 371:1100–1110
Wong C, Teitge B, Ross M, Young P, Robertson HL, Lang E. The accuracy and prognostic value of point-of-care ultrasound for nephrolithiasis in the emergency department: a systematic review and meta-analysis. Acad Emerg Med 2018; 25:684–698
Goertz JK, Lotterman S. Can the degree of hydronephrosis on ultrasound predict kidney stone size? Am J Emerg Med 2010; 28:813–816
Moore CL, Carpenter CR, Heilbrun ME, et al. Imaging in suspected renal colic: systematic review of the literature and multispecialty consensus. Ann Emerg Med 2019; 74:391–399
Körner H, Söndenaa K, Söreide J, et al. Incidence of acute nonperforated and perforated appendicitis: age-specific and sex-specific analysis. World J Surg 1997; 21:313–317
Fields JM, Davis J, Alsup C, et al. Accuracy of point-of-care ultrasonography for diagnosing acute appendicitis: a systematic review and meta-analysis. Acad Emerg Med 2017; 24:1124–1136
Mostbeck G, Adam EJ, Nielsen MB, et al. How to diagnose acute appendicitis: ultrasound first. Insights Imaging 2016; 7:255–263
Paulson EK, Thompson WM. Review of small-bowel obstruction: the diagnosis and when to worry. Radiology 2015; 275:332–342
Jang TB, Schindler D, Kaji AH. Bedside ultrasonography for the detection of small bowel obstruction in the emergency department. Emerg Med J 2011; 28:676–678
Gottlieb M, Peska GD, Pandurangadu AV, Nakitende D, Takhar S, Seethala RR. Utilization of ultrasound for the evaluation of small bowel obstruction: a systematic review and meta-analysis. Am J Emerg Med 2018; 36:234–242
Pourmand A, Dimbil U, Drake A, Shokoohi H. The accuracy of point-of-care ultrasound in detecting small bowel obstruction in emergency department. Emerg Med Int 2018; 2018:3684081
Becker BA, Lahham S, Gonzales MA, et al. A prospective, multicenter evaluation of point-of-care ultrasound for small-bowel obstruction in the emergency department. Acad Emerg Med 2019; 26:921–930
Hefny AF, Corr P, Abu-Zidan FM. The role of ultrasound in the management of intestinal obstruction. J Emerg Trauma Shock 2012; 5:84–86
Grassi R, Romano S, D’Amario F, et al. The relevance of free fluid between intestinal loops detected by sonography in the clinical assessment of small bowel obstruction in adults. Eur J Radiol 2004; 50:5–14
Radonjić T, Popović M, Zdravković M, et al. Point-of-care abdominal ultrasonography (POCUS) on the way to the right and rapid diagnosis. Diagnostics (Basel) 2022; 12:2052
Bacci M, Kushwaha R, Cabrera G, Kalivoda EJ. Point-of-care ultrasound diagnosis of pneumoperitoneum in the emergency department. Cureus 2020; 12:e8503
Langell JT, Mulvihill SJ. Gastrointestinal perforation and the acute abdomen. Med Clin North Am 2008; 92:599–625
Woodring JH, Heiser MJ. Detection of pneumoperitoneum on chest radiographs: comparison of upright lateral and posteroanterior projections. AJR 1995; 165:45–47
Jones R. Recognition of pneumoperitoneum using bedside ultrasound in critically ill patients presenting with acute abdominal pain. Am J Emerg Med 2007; 25:838–841
Chen SC, Yen ZS, Wang HP, Lin FY, Hsu CY, Chen WJ. Ultrasonography is superior to plain radiography in the diagnosis of pneumoperitoneum. Br J Surg 2002; 89:351–354
Shokoohi H, Boniface KS, Abell BM, Pourmand A, Salimian M. Ultrasound and Perforated viscus, dirty fluid, dirty shadows, and peritoneal enhancement. Emerg (Tehran) 2016; 4:101–105
Karahan OI, Kurt A, Yikilmaz A, Kahriman G. New method for the detection of intraperitoneal free air by sonography: scissors maneuver. J Clin Ultrasound 2004; 32:381–3
Tanya Moseley Professor of Diagnostic Radiology Department of Breast Imaging University of Texas MD Anderson Cancer Center
The ultimate game-changer in the breast biopsy world, stereotactic-guided breast biopsies allow breast imagers to offer their patients an amazing alternative to surgical biopsy. Not only is there a shorter recovery time compared to invasive surgical biopsies, but stereotactic core biopsy also leaves little to no scarring on the breast.
From theory to application, workshop participants will acquire a comprehensive understanding of breast biopsy indications, breast lesion characteristics, and modern breast imaging modalities. Whether you are an experienced practitioner or just commencing your breast biopsy voyage, our Featured Session will provide every tool you need to confidently and deftly navigate difficult scenarios, including both deep and superficial breast lesions, as well as patients with small, thin, or augmented breasts.
For emerging or unfamiliar technology, nothing beats a live demonstration of it—a proof of concept and the processes that make it easier to grasp everything. Instead of relying solely on textbook teaching or typical lecture-and-slides didactic session, our “Ready, Set, Stereotactic-Guided Breast Biopsies” presentation will allow radiologists to witness several really cool aspects of stereotactic core breast biopsy . . . up close!
An effective live demo, though, leverages its innate interactivity, welcoming everyone to become active participants in the continuing educational process. To that end, our esteemed subspecialized faculty have also prepared specific case-based examples to showcase this minimally invasive procedure for breast lesions only visible on imaging.
What further sets “Ready, Set, Stereotactic-Guided Breast Biopsies” apart is ARRS’ commitment to real-world knowledge, bridging the gap between abstract idea and practical implementation. Exploring the fascinating connections among anatomy and pathology, technique and technology, we will remain focused on the everyday nuances that arise in private, academic, and in-training breast imaging. Leaving no clinical stone unturned, you will leave us knowing how to best audit your own practice.
Fun and educational alike, our Featured Session and live demonstration on Sunday, May 5 satisfies two of the three hours of Category 1 CME for radiologists qualified as an interpreting physician under the Mammography Quality Standards Act.
Medical errors are common and can affect overall patient care. Radiology is integral in many aspects of overall patient care, and radiologists play a critical role. As such, radiologists can affect patient morbidity and mortality as a consequence of diagnostic error. Radiologists must recognize common forms of bias and become familiar with methods (both internal and external) to minimize them.
Diagnostic errors account for a significant cause of patient morbidity and mortality and are an understandable source of anxiety for patients, clinicians, and radiologists alike. The contribution of cognitive bias to diagnostic errors within radiology is well de- scribed, with Garland [1] first discussing differences in interpretations of chest radiographs. Since then, research has delved into the potential causes of diagnostic error and provided insight and a framework for understanding the basis of these errors and potential avenues for mitigation [2].
Cognitive Processes
Kanehman’s [3] Nobel prize-winning work first described critical concepts to understand cognition. In this framework, decision making can be divided into type 1 thinking (heuristics) and type 2 thinking (logic). Type 1 thinking is quick and involves mental shortcuts [4]; it is the muscle memory or gut reaction thinking necessary to accommodate the flood of millions of bits of sensory information processed by the brain at any given moment. Type 1 thinking allows one to make split-second decisions using limited available information, often based on experience, but it is also highly susceptible to cognitive bias. Type 2 thinking is slower and more deliberate. It is often used in completely novel situations. In radiology, an analogy would be the amount of time spent re- viewing a head CT study for the first time by a 1st-year radiology resident. The student would spend a significantly longer time reviewing the study, looking slowly and intentionally for each structure (type 2 thinking), potentially with an inefficient search pattern. Compare this to the amount of type spent by an experienced attending radiologist reviewing the same head CT study. Search patterns in this practitioner have become automatic (type 1 thinking) with attention to high-yield areas for pathologic entities and common blind spots that is based on experience. This muscle memory interpretation is what allows speed and efficiency, but it may also open the door to cognitive errors in diagnosis. A further challenge is that type 1 thinking becomes more common as an individual gets older, as more and more processes become compartmentalized [4]. Although this shift allows greater efficiency, it also creates greater opportunity for cognitive error.
Errors can occur at any time in the process, from initial perception to final image interpretation. In addition to internal fac- tors, systemic sources can also contribute to diagnostic errors in medicine [4, 5]. In this post, common errors along the path from initial perception to final interpretation will be reviewed and potential means for mitigating diagnostic errors will be discussed.
Perceptual Error
Errors in perception account for a large majority of interpretive errors in radiology. A number of factors contribute to errors in perception such as overall lesion conspicuity, including degree of contrast and border demarcation from adjacent soft tissue [5, 6].
Interpretive Error
More than 30 types of cognitive bias have been described [7]. The most commonly encountered forms of bias in diagnostic im- aging include anchoring bias, confirmation bias, framing bias, availability bias, premature closure, inattentional blindness, and hindsight bias.
Anchoring Bias
Also known as focalism, anchoring bias refers to the common human tendency to place undue influence or anchor on an initial diagnostic impression, despite later information to the contrary [5, 8, 9]. A radiologist’s initial gut reaction to a case, possibly made with limited initial information, can be difficult to deviate from and can potentially lead to useful information being disregarded.
Confirmation Bias
Conceptually related to anchoring bias is confirmation bias. In this case, data supporting an initially suspected diagnosis are sought, and contrary information is given less significance [8, 9]. As a result, diagnoses can be delayed, and potentially unnecessary procedures can be performed [10]. Further, this type of bias may also be encountered in the academic setting with attending radiologist review of preliminary reports by radiology trainees [11].
Framing Bias
In framing bias, different final diagnostic impressions can be made with the same information depending on the presentation of initial clinical information. In clinical context, different conclusions can be drawn from the same imaging study depending on the provided clinical history [10, 12]. Preliminary clinical history can be limited and potentially misleading [13, 14]. Further, the specialty of the referring physician may also be an influencing fac- tor [10].
Availability Bias
In cases of availability bias, recent in- formation is given undue influence in di- agnostic decision making [15]. Recently missed diagnoses may linger in the mind of a radiologist and allow him or her to attribute a rare diagnosis in a case that they may otherwise have not. For example, a radiologist labels a case as “septic arthritis with osteomyelitis” on elbow MRI, only later to find that the case was acute lymphoblastic leukemia. This error might lead the radiologist to diagnose leukemia on more routine cases of osteomyelitis, even with confirmatory laboratory and clinical findings sup- porting that diagnosis [9]. On the opposite end of the spectrum is the concept of non- availability bias; that is, diagnoses that are rarely encountered are rarely considered [9]. A variation of this bias is alliterative error, or satisfaction of report, commonly encountered in radiology as a repeat of a prior report’s impression, even if this might not have been interpreted in the same way de novo. This error has been reported as the fifth most common cause of diagnostic errors by Kim and Mansfield [16].
Premature Closure
Premature closure, the interpretation of initial conclusions as being final, is the overall most common type of error within clinical medicine [12, 17]. This er- ror includes the concept of satisfaction of search, in which an interpretive process is considered finished once an initial abnormality or finding is identified.
Inattentional Blindness
In the case of inattentional blindness, findings may be missed owing to their un- expected nature or their location at the periphery of the image. Corner shot findings on a radiograph or findings on the final im- ages of a cine clip of an ultrasound are examples of potential causes of inattentional blindness [16, 18–20].
Hindsight Bias
Hindsight bias is described as the tendency to de-emphasize the difficulty in making an initial diagnosis after the fact. This bias can occur in group settings including tumor boards, clinical conferences, and medicolegal settings and can prevent realistic assessment of challenges faced with complex initial diagnoses [9, 21].
External Factors
Interruptions are a common occurrence in a busy practice with visiting clinicians, telephone interruptions, and technologist requests. In the face of these interruptions it is easy for radiologists to lose their trains of thought and potentially deviate unknowingly from their typical search patterns. These interruptions have been shown to lengthen interpretation times and reduce accuracy in abnormal cases [22, 23].
Methods of Mitigation
Metacognition
A potential means of partially addressing cognitive bias is the concept of meta- cognition; that is, an individual can evaluate one’s own thought processes [22]. Metacognition involves introspection of one’s thought processes and seeking out- side perspectives.
Minimizing Interruptions
Although radiologists must balance pro- viding high-level service to referring clinicians with efficient use of their time, methods for minimizing interruptions are critical [5, 16]. Employing reading room assistants to field and triage calls can provide a first line of screening for telephone calls to aid in reducing interruptions [24]. Further use of text messaging services can also allow radiologists to communicate findings efficiently and document exact conversations [25].
Structured Reporting
Structured reporting provides a check- list-style framework for reporting that al- lows reminders for interpreting radiologists to review all relevant anatomy. For trainees, this process also allows the development of desired interpretive search patterns [26].
Radiologic-Pathologic Review
Follow-up on challenging cases either through quality-control conferences, tumor boards, or personal review of cases is critical for improving and expanding radiologists’ interpretive skills. Supportive and educationally oriented environments can allow meaningful discussion and review of diagnostically challenging cases.
Computer-Aided Diagnostics
Use of increasingly powerful means of computer-aided image interpretation pro- vides another potential tool for radiologists to improve diagnostic accuracy and increase confidence. The current effective- ness of computer-aided detection within areas such as mammography has not been shown to be improved over interpretation without computer-aided detection [27]. However, there is growing potential for ap- plications in multiple other areas with use of neural network–based approaches [28].
The impact of bias in radiologic interpretation can be substantial, with potential implications in patient outcomes. Better understanding the forms of bias, related to both internal and external pressures, can allow radiologists to implement methods for mitigating these biases.
REFERENCES
Garland LH. Studies on the accuracy of diagnostic procedures. Am J Roentgenol Radium Ther Nucl Med 1959; 82:25–38
Degnan AJ, Ghobadi EH, Hardy P, et al. Percep- tual and interpretive error in diagnostic radiology: causes and potential solutions. Acad Radiol 2019; 26:833–845
Tversky A, Kahneman D. Judgment under un- certainty: heuristics and biases. Science 1974; 185:1124–1131
Durr T. Thinking, fast and slow by Daniel Kahneman. (book review) AmJEduc2014; 120:287–291
Waite S, Scott J, Gale B, Fuchs T, Kolla S, Reede D. Interpretive error in radiology. AJR 2017; 208:739–749
Patel SH, Stanton CL, Miller SG, Patrie JT, Itri JN, Shepherd TM. Risk factors for perceptual-versus- interpretative errors in diagnostic neuroradiology. AJNR2019; 40:1252–1256
Rosenkrantz AB, Bansal NK. Diagnostic errors in abdominopelvic CT interpretation: characteriza- tion based on report addenda. Abdom Radiol (NY) 2016; 41:1793–1799
Croskerry P. The importance of cognitive errors in diagnosis and strategies to minimize them. Acad Med2003; 78:775–780
Croskerry P. Achieving quality in clinical decision making: cognitive strategies and detection of bias. AcadEmergMed2002; 9:1184–1204
Busby LP, Courtier JL, Glastonbury CM. Bias in radi- ology: the how and why of misses and misinterpre- tations. RadioGraphics2018; 38:236–247
Nanapragasam A, Bhatnagar P, Birchall D. Trainee radiologist reports as a source of confirmation bias in radiology. ClinRadiol2018; 73:1052–1055
Lee CS, Nagy PG, Weaver SJ, Newman-Toker DE. Cognitive and system factors contributing to diag- nostic errors in radiology. AJR2013; 201:611–617
Loy CT, Irwig L. Accuracy of diagnostic tests read with and without clinical information. JAMA 2004; 292:1602–1609
Dumitrescu A, Ryan CA. Addressing the taboo of medical error through IGBOs: I got burnt once! Eur J Pediatr 2014; 173:503–508
Kim YW, Mansfield LT. Fool me twice: delayed diag- noses in radiology with emphasis on perpetuated errors. AJR2014; 202:465–470
Graber ML, Franklin N, Gordon R. Diagnostic er- ror in internal medicine. Arch Intern Med 2005; 65:1493–1499
Drew TH, Võ ML, Wolfe JM. The invisible gorilla strikes again. PsycholSci2013; 24:1848–1853
Beanland V, Pammer K. Gorilla watching: effects of exposure and expectations on inattentional blind- ness. In: 9th Conference of the Australasian Society for Cognitive Science. Sydney, Australia: Macquarie Centre for Cognitive Science, 2010:12–20
Drew TH, Vo ML, Olwal A, Jacobson F, Seltzer SE, Wolfe JM. Scanners and drillers: characterizing ex- pert visual search through volumetric images. J Vis 2013; 13:3
Gunderman RB. Biases in radiologic reasoning. AJR 2009; 192:561–564
Flavell JH. Metacognition and cognitive monitoring: a new area of cognitive-developmental inqui- ry. Am Psychol 1979; 34:906–911
Wynn RM, Howe JL, Kelahan LC, Fong A, Filice RW, Ratwani RM. The impact of interruptions on chest radiograph interpretation: effects on reading time and accuracy. Acad Radiol 2018; 25:1515–1520
Ngo JS, Maxfield CM, Schooler GR. The current state of radiology call assistant triage programs among US radiology residency programs. Acad Radiol 2018; 25:250–254
Torres A, Milov DE, Melendez D, Negron J, Zhao JJ, Lawless ST. A new approach to alarm manage- ment: mitigating failure-prone systems. J Hosp Adm2014; 3:79–83
Marcovici PA, Taylor GA. Structured radiology re- ports are more complete and more effective than unstructured reports. AJR2014; 203:1265–1271
Lehman CD, Wellman RD, Buist DSM, Kerlikowske K, Tosteson ANA, Miglioretti DL. Diagnostic accuracy of digital screening mammography with and with- out computer-aided detection. JAMA Intern Med 2015; 175:1828
Taylor AG, Mielke C, Mongan J. Automated detection of moderate and large pneumothorax on frontal chest X-rays using deep convolutional neural networks: a retrospective study. PLoSMed2018; 15:e1002697
Artificial intelligence (AI) has been likened to a new species, “Auto Sapiens.” I know this is wild, but bear with me—it may actually help us “get along,” “collaborate,” and “lead” AI to improve radiology practice.
A recent Harvard Business Review article by Jeremy Heimans and Henry Timms explained Auto Sapiens: AI is able to act autonomously, make decisions, learn from experience, and operate without continuous human supervision, hence “Auto.” Also, AI possesses knowledge and the ability to make judgments in context, hence “Sapiens.” It is hard to think of Auto Sapiens when it’s software running on your data, but it is valid considering this terminology when thinking of AI used in humanoid robots.
As a thought exercise, let’s think of radiology AI as an Auto Sapiens, and a coworker in the role of an “assistant.” Is this assistant going to take our jobs? Will it (they?) help us in our jobs, and could it make radiology practice more profitable? I say, no, to taking our jobs. And, yes, to helping us change our practice for the better.
Here is how: I believe that AI will not displace radiologists. Somebody needs to be liable for mistakes made by AI. Medical malpractice can be established when physicians deviate from the profession’s standard of patient care. If a radiologist uses an AI-enabled medical device for diagnosis or treatment of a patient, and their use deviates from an established standard of care, the physician could be liable for improper use of that AI medical device. As of now, the radiologist must independently review the AI’s recommendations, applying the standard of care in treating the patient regardless of the AI’s output. After all, AI is an assistant needing supervision, right?
Holding AI developers liable is quite difficult. One would have to prove that the AI was defective at the time of product purchase by the user and did not become corrupt as it continued to train itself on user data. There are currently no sufficient industry standards to address this.
I doubt that insurers would take liability; they lack the expertise to minimize liability should an AI application go awry. Radiologists are the ones assuring AI performs consistently in accordance with their intended purpose and scope, as well as at the desired level of precision. Insurers do not have the expertise to check on radiology AI applications’ correctness, relevance, robustness, or interpretability. Radiologists will be the stewards of quality assurance for AI.
I do, however, wonder about a threat to reimbursements. It is conceivable that AI can evolve to perform better than radiologists—faster and with fewer errors. In that event, insurers could cut physician fees. We need to think about reimbursements in the AI era. Will there be a new component to the fee schedule, such as “AI supervision,” which entails auditing and supervising AI? We will need to continuously “invest” in our AI assistants to make sure they are trained up to the latest technological standard.
OK, now that I’ve argued how AI will not replace radiologists, let’s see how our new assistants will help us. First, Auto Sapiens, like a good assistant, will happily do all the stuff many of us like less about our jobs, such as reading endless chest radiographs, scrutinizing CT images for lung nodules, measuring lesions and transcribing measurements into reports, and so many other things. Yes, I want this assistant, like, now!
Additionally, Auto Sapiens will also help us decrease errors of perception and interpretation and delays for reporting incidental critical results, such unexpected intracranial hemorrhage on a nonemergent head CT. What is not to like about this type of assistant? Maybe liability insurance payments will even come down?
And all of this can result in a more profitable business? Sure, as soon as AI enables radiologists, technologists, and imaging equipment to handle larger volumes, there could be a massive increase of imaging orders. Dream on, though, if you think that decision support will help us control imaging utilization. Imaging is already being used in lieu of a thorough clinical exam. In fact, Dr. Joseph Alpert called the physical exam “an ancient ritual” in 2019.
So, the AI assistant can help us grow our business and focus on work we enjoy, like making a diagnosis and providing excellent services to physicians and patients. However, this model relies on us being proper supervisors to our AI assistants. As Curtis Langlotz, MD, PhD, once put it: “AI won’t replace radiologists, but radiologists who use AI will replace those who don’t.”
The time to learn about AI is now, and I am excited about it!
Director for Quality, Department of Radiology, Children’s Healthcare of Atlanta Interim Director for Quality, Department of Radiology and Imaging Sciences, Emory Healthcare Professor, Emory University School of Medicine
I am an abdominal radiologist and professor of radiology and urology at the University of North Carolina at Chapel Hill. In my current role of executive vice chair, I have worked on several initiatives to improve work-life balance across all members of the team: faculty, residents, and staff.
In my view, small tweaks can lead to great improvement. Optimization of worklists to equalize efforts and/or allow for flexibility or remote interpretation has been key to finding that balance of teaching, clinical acuity, and clinical load for our team. These tweaks allow faculty to have autonomy and flexibility in their work and daily lives.
Efforts to help physicians practice at their level are equally important. Automation of protocols, software to propagate measurements from ultrasound examinations straight to reports, and motivated staff to help relay and close the loop on incidental findings are all examples of such efforts. It’s a constant work-in-progress that requires a unified team with open and honest communication between all team members.
Lauren M.B. Burke, MD, FSAR
Executive Vice Chair
Professor of Radiology and Urology
Department of Radiology
University of North Carolina at Chapel Hill
In “Words of Wellness” on www.radfyi.org/, members of the ARRS Wellness Subcommittee share what “wellness” and “wellbeing” mean in their own clinical practices, research focuses, and everyday lives.
Dr. Burke’s ARRS “Sound of Wellness” Playlist Selection: