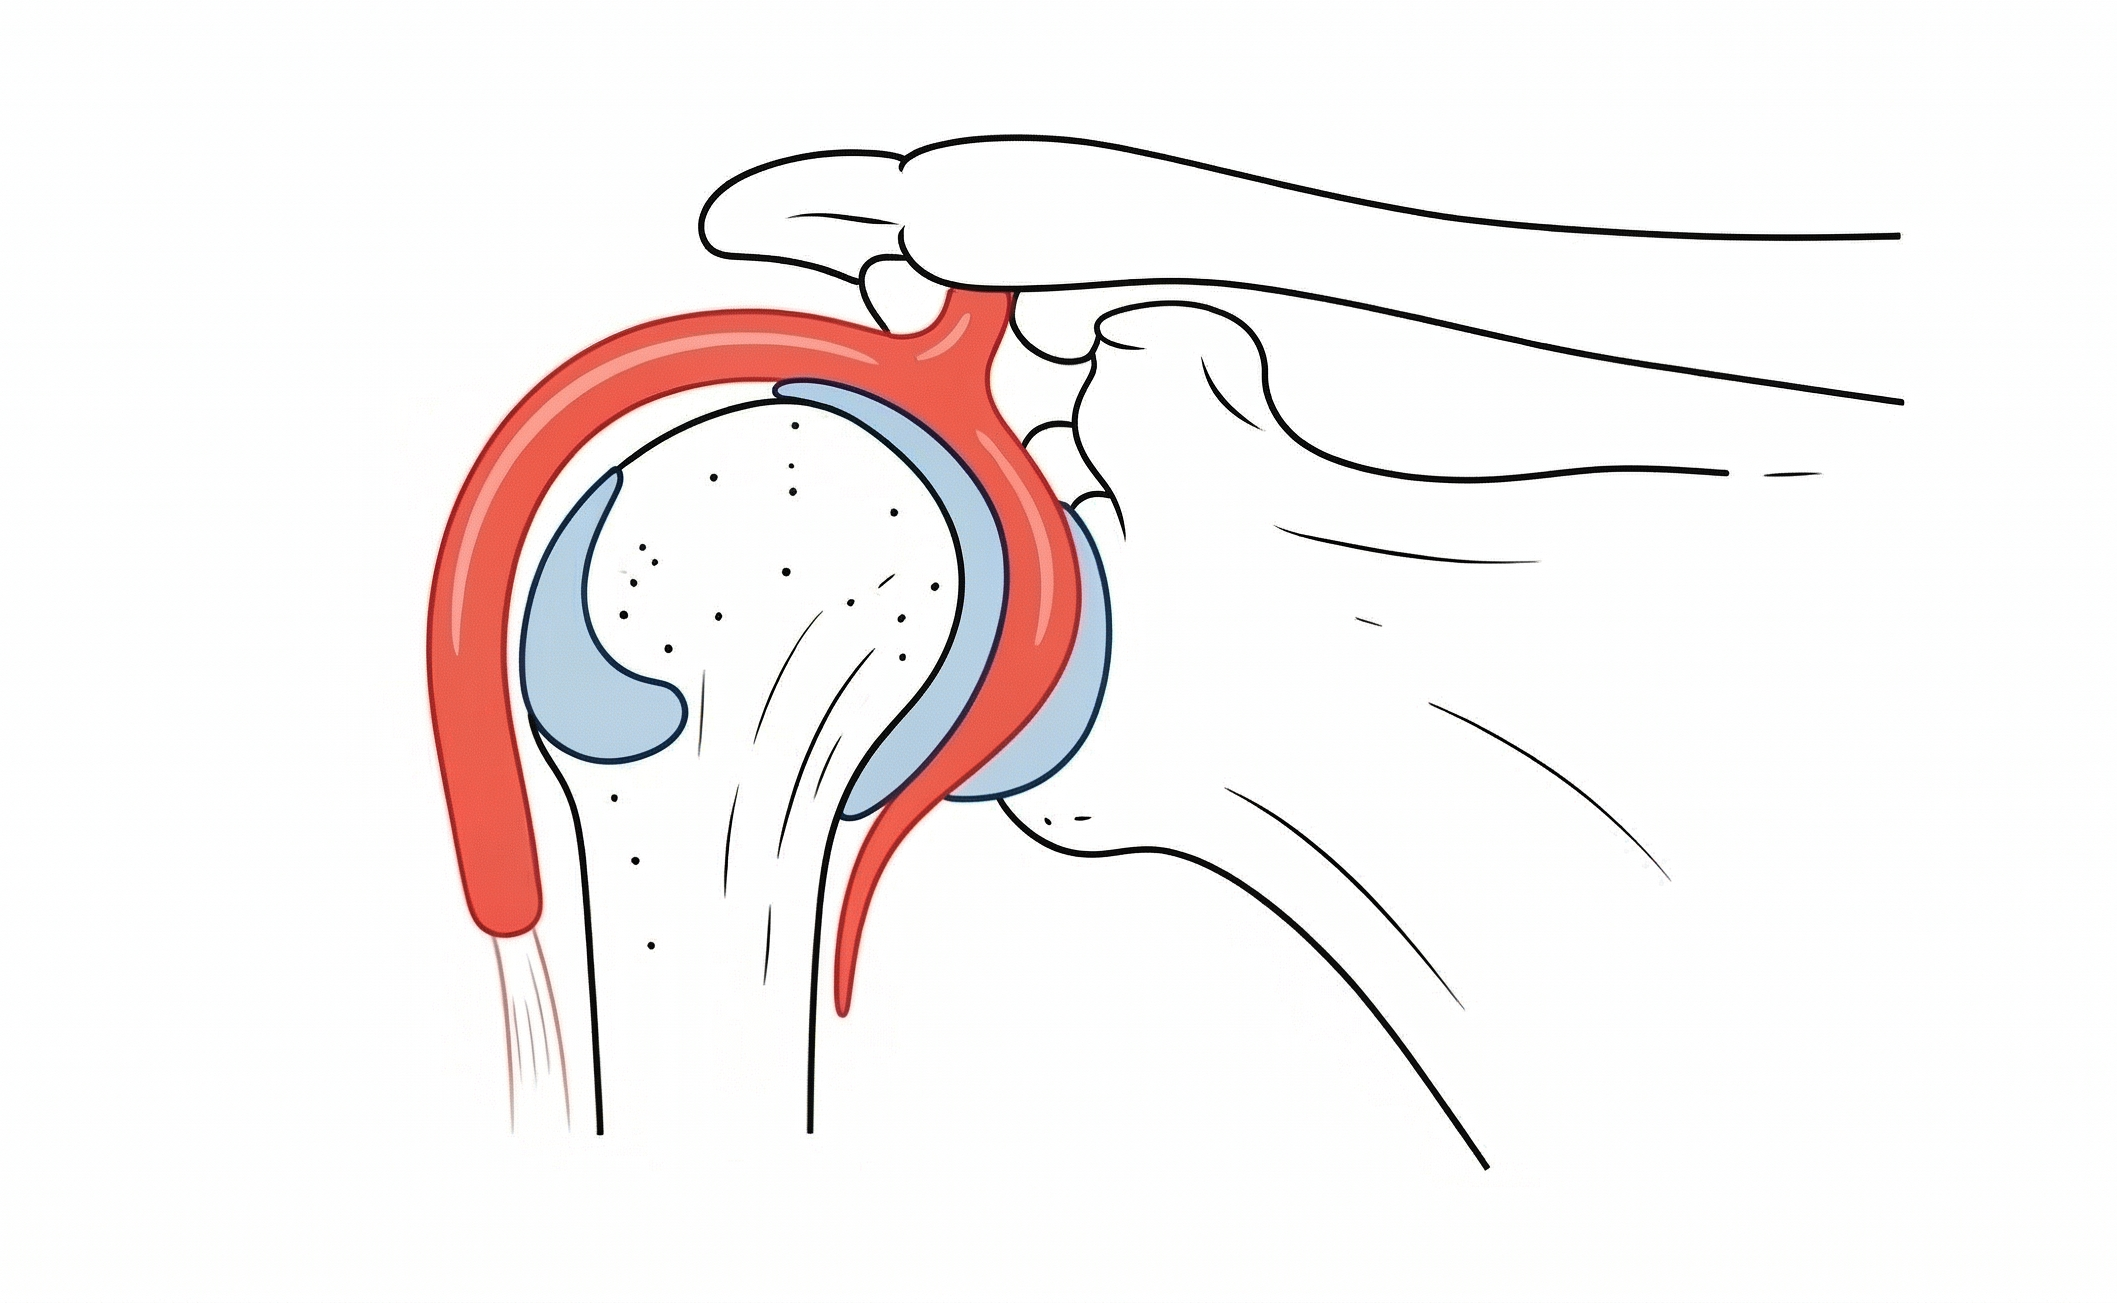
Author: Logan Young

  • Pediatric Bone Marrow MRI—Is It Leukemia?

    Pediatric Bone Marrow MRI—Is It Leukemia?

    When a pediatric patient presents with back pain, MRI of the spine is a powerful tool to distinguish between benign and malignant processes. In this case of a 7-year-old girl from a Quick Byte presentation by Laura M. Fayad, MD, the imaging reveals systemic replacement of the normal bone marrow.

    Primary Observations

    • Darkness: On T1-weighted imaging, the marrow signal is abnormally dark.
    • Vertebral Compression: Multiple areas of the spine show vertebral body height loss and fractures.
    • Diagnostic Worry: Indeed, this combination of diffuse signal abnormality and pathologic fractures is highly concerning for leukemia.

    Dixon for Clarification: To confirm if the marrow has been replaced by tumor, a variation of the in-and-out-of-phase gradient echo, the Dixon technique, can be used. Dixon provides fat-only and water-only images to isolate specific tissues.

    • Fat-Only Imaging: In a normal patient, fat should be visible within the marrow.
    • The Dropout Test: In this patient, while fat is clearly visible in the subcutaneous and epidural spaces, there is a complete absence of fat signal within the bone marrow.
    • Conclusion: The total lack of marrow fat indicates that the space has been entirely replaced by malignant cells.

    Fat Fraction Analysis: Beyond visual inspection, we can measure the MRI fat fraction to provide an objective data point.

    • 10% Rule: In pediatric patients, a fat fraction of less than 10% is a significant indicator of malignant bone marrow.
    • Comparison: Normal control marrow typically maintains a much higher fat fraction, often ranging from 20% to over 50%.
    Marrow CategoryMRI Fat Fraction (%)Clinical Significance
    Malignant< 10%Highly concerning for leukemia or tumor infiltration.
    Normal (Controls)> 20%Indicates healthy, fat-containing marrow for age.
  • Vascular DECT: From Clot Detection to Perfusion Proof

    Vascular DECT: From Clot Detection to Perfusion Proof

    The Problem: Traditional CTA is a structural map. It tells you there is a fallen tree on the road (i.e., the clot), but it doesn’t always tell you if the traffic has stopped (i.e., the perfusion). In subsegmental disease or “dirty” scans with beam-hardening artifacts, structural-only imaging leaves radiologists in the equivocal trap.

    The Fix? As the ARRS Online Course “Practical Dual-Energy CT Throughout the Body” points out, by pairing iodine quantification with anatomical imaging, rads can move from searching for filling defects to visualizing physiologic impact.

    The Breakdown—A multi-vector look at a left subsegmental PE...

    Standard Blended—We see the “What.” A classic peripheral wedge-shaped opacity: Hampton Hump (solid arrow). There is a subtle luminal filling defect in the feeding vessel (arrowhead), but in a motion-degraded scan, you might doubt it.

    Iodine Map—We see the “So What.” The red overlay represents iodine concentration. The dashed arrows highlight a perfusion “cold zone.” This wedge-shaped defect provides orthogonal confirmation that the clot isn’t just an artifact; it’s a functional obstruction.

    Vessel Analysis—This reconstruction isolates iodine signal. Note the iodine dropout (arrowhead) within the artery. This removes the noise of the lung parenchyma to focus strictly on the continuity of the blood column.

    3D Perfusion—The “Global Impact.” This 3D volume rendering maps the total territory of the ischemic lung (red zones). It’s the visual shorthand for clinical severity.

    Push for DECT in Your PE Protocol?

    • Tie-Breaker: Small distal clots are often equivocal. If you see a corresponding wedge-shaped perfusion defect on the iodine map, your confidence in calling a subsegmental PE jumps from “possible” to “definitive.”
    • Artifact Insurance: Beam hardening from dense contrast in the SVC often obscures the right upper lobe. DECT iodine maps help differentiate true clots from “pseudo-filling defects” caused by photon starvation.
    • Infarct Prediction: A Hampton Hump is a late sign of infarction. DECT identifies the ischemic penumbra (the area at risk) before it potentially progresses to permanent tissue death.

    Bottom Line: DECT transforms PE imaging from a binary search (clot vs. no Clot) into a physiologic assessment (obstruction + ischemia). Result? Fewer “equivocal” reports and higher diagnostic defensibility.

  • MSK DECT: Clarity Through the Metal and Beyond

    MSK DECT: Clarity Through the Metal and Beyond

    Dual-energy CT (DECT) is becoming a must-use tool in musculoskeletal (MSK) imaging—not just for hardware, but for crystals, marrow, and trauma. Orthopedic imaging often suffers from two problems: metal streak and ambiguous density. But as the ARRS Online Course “Practical Dual-Energy CT Throughout the Body” duly notes, DECT tackles both by separating materials and controlling photon energy, giving rads clearer views of bone, soft tissue, and implant interfaces.

    Where Does DECT Make the Biggest Difference?
    1. Metal Artifact Reduction (MAR) That Actually Works

    High-keV VMIs (110–150 keV) reduce photon starvation and scatter from:

    • Spine instrumentation
    • Hip and knee arthroplasties
    • Fracture fixation hardware
    • Shoulder anchors

    Result: cleaner cortices, more visible fractures, and better evaluation of infection or loosening.

    Portal venous phase abdominal CT images obtained after spinal reconstruction surgery. Left, Normal blended image shows considerable amount of metal artifact (arrow) overlaying left kidney and good contrast in portal veins (arrowhead). Center, Virtual monoenergetic image of same slice shown in Left, obtained at 50 keV, shows high portal venous contrast (arrowhead) and high amounts of metal artifact (arrow).Right, Virtual monoenergetic image of same slice shown in Left, obtained at 150 keV, reveals decreasing amounts of metal artifact (arrow) and loss of portal venous contrast (arrowhead).

    2. Crystal Imaging: Knowing Exactly What You’re Looking At

    Material decomposition differentiates uric acid from calcium, which helps:

    • Confirm gout even in unusual locations (spine, tendons, postoperative joints)
    • Distinguish gout from infection or tumor
    • Map tophus burden for treatment decisions

    Patient with suspected tophus of first interphalangeal joint caused by gout. Left, Mixed CT image that is equivalent to single-energy scan acquired at 120 kVp shows tophus (arrowhead). Right, Material decomposition image applied to highlight urate crystals (green area indicated by arrowhead) confirms that lesion seen on regular CT scan is tophus caused by gout.

    3. Bone Marrow Edema Detection

    DECT water-specific reconstructions reveal bone marrow edema in trauma, stress injuries, and arthritis (especially helpful when MRI is unavailable or contraindicated).

    Why Are MSK Rads Adopting DECT?
    • Saves nondiagnostic postoperative studies
    • Improves fracture conspicuity
    • Reduces MRI dependence
    • Helps differentiate infection, inflammation, and crystal deposition
    • Speeds up decision-making for orthopedic surgeons

    Bottom Line: MSK DECT is no longer just “nice to have.” When hardware, crystals, or marrow ambiguity stand in the way, DECT gives you answers a conventional CT simply can’t.

  • Nomograms for Stratifying Prostate Cancer Risk—Where Imaging Changes the Equation

    Nomograms for Stratifying Prostate Cancer Risk—Where Imaging Changes the Equation

    PSA screening alone lacks specificity, leading to substantial overbiopsy and detection of indolent disease. Nomograms—multivariable risk calculators—were developed to move prostate cancer assessment beyond single thresholds. As Drs. Benjamin Tran, Janelle T. West, Soroush Rais-Bahrami, and Kristin K. Porter noted in their ARRS Online Course, the most effective tools integrate clinical variables with mpMRI, making rads central to risk stratification rather than downstream reporters.

    Why Nomograms Matter: Traditional PSA-based decision-making treats all patients similarly despite wide variation in underlying risk. Nomograms combine multiple predictors—PSA, prostate volume, digital rectal exam, age, biopsy history, and increasingly PI-RADS assessment—to estimate an individual’s probability of harboring clinically significant prostate cancer (csPCa).

    Multiple studies show that nomograms incorporating MRI outperform PSA alone and MRI alone, improving discrimination while safely reducing unnecessary biopsies.

    mpMRI’s Role: mpMRI is not just an add-on variable; it is a dominant driver of modern risk models. PI-RADS category, lesion size, and PSA density materially alter predicted risk.

    MRI-integrated nomograms consistently achieve AUCs in the 0.80–0.88 range for csPCa detection, while reducing biopsy rates by 20–34% depending on the population and risk threshold chosen. In practical terms, this means fewer low-yield biopsies without a clinically meaningful increase in missed aggressive cancers.

    For rads, this elevates the importance of:

    • Accurate PI-RADS categorization
    • Consistent prostate volume measurement
    • Clear reporting of lesion location and size

    Small changes in PI-RADS score can significantly shift nomogram output and clinical decision-making.

    47-year-old man with history of two negative systematic biopsies at another facility and increasing PSA level (most recently, 35.6 ng/mL). Multiparametric MRI was performed for persistent clinical suspicion of clinically significant prostate cancer

    Top to Bottom: Axial T2-weighted (Top), axial high-b-value (2000 s/mm2) (Middle), and calculated ADC (Bottom) MR images show left apical anterior central gland lesion (arrow) with very high suspicion of being clinically significant prostate cancer. Lesion is PI-RADS category 5. MRI–transrectal ultrasound fusion biopsy of lesion resulted in pathologic diagnosis of prostatic adenocarcinoma, Gleason 4 + 3 = 7 (grade group 3). Gleason 4 pattern represents 60% of tumor. Prostate volume calculated with MRI is 40 mL.

    PSA Density—A Critical Modifier: PSA density (PSAD) is one of the most powerful adjuncts to PI-RADS. In patients with PI-RADS 1–2 or equivocal PI-RADS 3 lesions, PSAD meaningfully improves negative predictive value—often approaching 90%—and helps identify patients who can safely avoid biopsy.

    This is especially relevant in biopsy-naïve men, where avoiding the first biopsy carries the greatest downstream benefit.

    Matching Nomogram and Patient: No single nomogram fits every clinical scenario. Some are optimized for biopsy-naïve patients, others for men with prior negative biopsy, and some for mixed cohorts. Understanding these distinctions prevents misapplication and overconfidence in a single risk estimate.

    Another important limitation is population dependency. Many widely used nomograms were derived from European or predominantly White cohorts. Without external validation, these tools may overestimate risk in Asian populations and other underrepresented groups. Local calibration and clinical judgment remain essential.

    47YO man with two negative systematic biopsies (same patient)

    Screenshot of Stanford Prostate Cancer Calculator (SPCC) nomogram calculation shows 99% probability of clinically significant prostate cancer before repeat biopsy. This prediction can be shared with patient during counseling about recommendation for repeat biopsy. Result of repeat MRI– transrectal ultrasound fusion biopsy was consistent with prostatic adenocarcinoma: Gleason 4 + 3 = 7 (grade group 3). Gleason 4 pattern represented 60% of tumor.

    What Does This Mean for Rads? Nomograms reposition rads as active participants in prostate cancer decision-making. High-quality MRI interpretation directly influences whether a patient undergoes biopsy, surveillance, or reassurance.

    In multidisciplinary care, radiologists who understand nomogram inputs and limitations can:

    • Explain risk estimates to urologists with confidence
    • Support biopsy deferral when appropriate
    • Improve alignment between imaging findings and management
    Nomogram / CalculatorBest Use CaseKey InputsStrengthsLimitations
    MRI-ERSPC RC3 / RC4Biopsy-naïve patientsPSA, PSAD, DRE, prostate volume, PI-RADSStrong external validation; good balance of biopsy reduction and csPCa detectionDerived largely from European cohorts
    ModRadBiopsy-naïve patientsPSA, PSAD, PI-RADS, clinical variablesHigh discrimination; MRI-forward designLess validated in prior biopsy populations
    ModDisPrior negative biopsyPSA, PSAD, PI-RADS, biopsy historyReduces repeat biopsies while maintaining csPCa sensitivityLess applicable to biopsy-naïve patients
    Stanford Prostate Cancer CalculatorMixed populationsPSA, DRE, biopsy history, MRI findingsBroad applicability; flexible inputsSlightly lower performance than MRI-specific models
    PCPT Risk CalculatorLegacy / screening contextPSA, age, race, DREHistorically influentialDoes not incorporate MRI; lower specificity
    ERSPC (non-MRI)Screening populationsPSA, DRE, prostate volumeWell studiedOutperformed by MRI-integrated tools

    Bottom Line: mpMRI-integrated nomograms transform prostate cancer assessment from threshold-based screening to personalized risk prediction. Radiologists who deliver precise PI-RADS scoring and understand how those scores drive nomograms add measurable, patient-level value.


  • CMS May Undo a 104% CCTA Payment Increase

    CMS May Undo a 104% CCTA Payment Increase

    The American College of Radiology (ACR) is sounding the alarm for hospital-based imaging providers: a recent, massive pay increase for Coronary CT Angiography (CCTA) is at risk of being revoked unless facilities change how they bill for these services.

    Big Picture: In its 2025 final rule, CMS temporarily moved CCTA (CPT 75572–75574) from a Level 1 to a Level 2 Ambulatory Payment Classification (APC).

    The Windfall: Technical fees jumped 104%, rising from $175 in 2024 to $357 currently.

    The Catch: CMS made this change “provisionally.” If fewer than 50% of hospitals update their billing to reflect the true resource intensity of CCTA, Medicare will revert to the lower, generic CT payment rates.

    CY 2024APC 5571CY 2025APC 5572% Change
    Hospital Outpatient (OPPS)$175$357+104%
    Physician Office (PFS)$285$318 +12%

    The Friction: Historically, hospitals were forced to use a generic “CT Scan” revenue code (0350), which has a lower cost-to-charge ratio. CMS has now removed the “Return to Provider” edits that blocked hospitals from using more accurate codes.

    Action Items: To make the pay hike permanent, the ACR, American College of Cardiology, and Society of Cardiovascular Computed Tomography all recommend:

    • Update Charge Masters: Map CCTA CPT codes to Cardiology (0480/048x) or Other Imaging Services (040x) revenue codes.
    • Reflect Intensity: Reporting costs under these specific codes demonstrates the specialized nursing and resource needs that justify the higher APC level.
    • Monitor Denials: Ensure clearinghouses and private payers accept the updated cardiology revenue codes.

    Bottom Line: If facilities continue to report CCTA expenses as identical to generic CT scans, the data will fail to support the higher payment level, and the $182-per-scan “bonus” will vanish.

  • DECT to the Edges: Photon-Counting CT in the ED

    DECT to the Edges: Photon-Counting CT in the ED

    Dual-energy CT (DECT) has become a workhorse in emergency imaging, particularly for iodine mapping and virtual noncontrast applications. But as Aaron Sodickson, MD, reveals in a presentation now available in the ARRS Quick Bytes library, conventional DECT systems come with a quiet limitation: dual-energy information is not uniformly available across the entire field of view. Photon-counting CT (PCCT) changes that.

    Left: What you see here is that on our existing high-end dual-energy scanners, we have a slight limitation, which is that we don’t get dual-energy information outside this yellow-dotted circle. Right: While we have iodine content centrally, we don’t have anything out in the periphery.

    There Are Limits: On many high-end dual-energy scanners, iodine maps are only reliable within a central circular region. Outside that area, dual-energy information is lost. In large patients or peripheral anatomy, this can mean incomplete iodine characterization and diagnostic uncertainty.

    Here’s another example of the same thing, where you can see that we’ve lost our information out at the edges.

    In practice, you may see clean iodine signal centrally, but nothing at the edges—simply because the system cannot acquire dual-energy data beyond that geometric constraint.

    PCCT Is Built Different: PCCT acquires spectral information directly at the detector. Because it does not rely on paired detector geometries or source-based separation, dual-energy information is available across the entire field of view, meaning:

    • Iodine maps extend fully to the periphery
    • Large patients no longer fall outside the dual-energy zone
    • Edge anatomy benefits from the same spectral data as the center

    In the ED, where patient size and positioning are unpredictable, this matters.

    On the photon-counting scanner, all of this dual-energy information content is acquired at the detector, so we don’t geometrically need the two CT detectors that are being used in our conventional scanner. Thus, we can get dual-energy information all the way out to the edges, even in large patients outside that field of view.

    Better-Behaving Noise: Another practical advantage of PCCT is cleaner iodine post-processing. DECT maps may show speckled signal in non-enhancing structures—algorithmic noise that can mimic low-level enhancement.

    In this example below of a renal cyst, conventional DECT shows scattered orange signal that is not true enhancement. On PCCT, that noise is substantially reduced, allowing confident classification of a benign, non-enhancing complex cyst.

    Looking at this renal cyst on a conventional scan, you see some noise in the iodine post-processing content (e.g., green arrow in orange speckle). There isn’t actually enhancement within this cyst; this is noise in the algorithm. On the photon-counting scanner, we’re able to knock down that noise to see much more cleanly that this is a non-enhancing, benign, complex cyst.

    Why This Matters in the ED: Emergency radiology rewards speed and certainty; PCCT improves both by:

    • Preserving iodine data across entire image
    • Reducing false-positive enhancement
    • Increasing confidence in lesion characterization
    • Decreasing need for follow-up imaging

    Bottom Line: Photon-counting CT removes the “edge problem” of conventional DECT. By delivering full-field spectral data with improved noise characteristics, PCCT strengthens iodine-based interpretation—exactly where ED imaging needs it most.

  • Liver Fat Quantification: Billing, Workflow, and Real-World Use

    Liver Fat Quantification: Billing, Workflow, and Real-World Use

    Fatty liver has become so common that trainees often see steatosis more frequently than a normal liver. During the latest AJR Forum on Quantitative Ultrasound, David Fetzer, MD, asked Roentgen Fund recipient Theodore Pierce, MD, a practical question regarding liver fat assessment:

    Are practices billing for liver fat quantification, and is it performed alone or bundled with other exams?

    The Big Picture

    Liver fat quantification is increasingly embedded in routine abdominal imaging. But billing practices, reimbursement, and workflow integration vary widely across institutions. Dr. Pierce noted that while they do code and submit billing for fat quantification, reimbursement remains inconsistent at this stage.

    Key Takeaways

    Billing is performed, even though reimbursement is not yet reliable. Fat quantification is coded whenever performed. Reimbursement is infrequent but expected to improve as adoption grows and payers recognize the clinical value.

    Standalone liver fat quantification exists, but it is rarely used. Although offered as its own CPT-coded exam, most clinicians prefer to order it in combination with either a limited right upper quadrant ultrasound or with both RUQ ultrasound and elastography. The combination is determined by the referring clinician and the specific clinical question.

    Interpretation requires clinical and imaging context. As Dr. Fetzer emphasized, fat quantification values are interpreted alongside B-mode appearance and elastography stiffness to evaluate steatosis, fibrosis, and inflammation. The combined data provide a more accurate assessment than any single technique alone.

    Bottom Line

    Liver fat quantification is billable, clinically valuable, and most informative when paired with RUQ ultrasound and elastography. Utilization is increasing, reimbursement frameworks are evolving, and the technique is moving toward becoming a routine component of hepatic imaging.

  • Midgut Malrotation and Volvulus in Children: US or Upper GI?

    Midgut Malrotation and Volvulus in Children: US or Upper GI?

    In smaller hospitals, choosing between ultrasound or upper GI for suspected malrotation can feel high-stakes. During the latest AJR Live Webinar, Jonathan Dillman, MD, and HayThuy Nguyen, MD, tackled a key question:

    Should community hospitals perform both ultrasound and upper GI—or is one enough before transferring a child?

    The Big Picture

    Even though ultrasound for midgut volvulus performs incredibly well in published studies, your institutional comfort and consistency matter. Smaller centers may see fewer neonates, and that affects how confident technologists and radiologists feel with real-time sonographic anatomy.

    Dr. Nguyen’s advice: Start with both. Build confidence. Then taper.

    Key Takeaways

    Ultrasound + Upper GI Can Be Complementary, At First

    • Even at large centers, both exams are often paired early on.
    • Not because ultrasound underperforms, but because every institution needs their own “local data.”
    • Once your team demonstrates consistently accurate ultrasound performance, you can safely drop routine upper GI.

    See a Whirlpool Sign? Call Surgery!

    A positive whirlpool sign on ultrasound is highly specific. No need to wait for additional imaging; direct referral to pediatric surgery is appropriate.

    No Whirlpool, but Symptoms Persist → Consider Upper GI or Transfer

    Ultrasound may still be equivocal in some infants. Upper GI remains a helpful confirmatory test when the diagnosis is uncertain but suspicion stays high.

    Don’t Forget: CT or MRI Can Make the Diagnosis for Older Kids

    Dr. Dillman emphasized that adolescents or older children being scanned for unrelated reasons may still show:

    • SMV/SMA reversal
    • Swirling mesentery
    • Engorged mesenteric vessels
    • Collaterals

    Even a noncontrast CT for renal stone can incidentally reveal the vascular swirl. MRI—especially rapid MR protocols—can also depict abnormal vascular orientation.


    Bottom Line

    Start with both ultrasound and upper GI, if your institution needs to build confidence. Once your team demonstrates reliable ultrasound performance, ultrasound alone is often sufficient…and a positive whirlpool sign should trigger immediate surgical evaluation.

  • Scimitar Syndrome with Horseshoe Lung: Key Imaging Clues

    Scimitar Syndrome with Horseshoe Lung: Key Imaging Clues

    Scimitar syndrome represents a distinctive form of right lung partial anomalous pulmonary venous return. It is classically associated with right lung hypoplasia, abnormalities of the right pulmonary artery, and a characteristic anomalous vein draining into the systemic venous system. As Abbey J. Winant, MD, MFA, illustrates in “Pediatric Thoracic Vascular Disorders: Congenital to Acquired Pathology,” CTA plays a central role in defining venous anatomy and identifying associated anomalies.

    What Defines Scimitar Syndrome?

    Scimitar syndrome (RLL PAPVR) with R Lung hypoplasia

    The hallmark is a right lower lobe pulmonary vein draining anomalously—most often into the inferior vena cava, but occasionally into the inferior right atrium. This vein produces the classic “scimitar” appearance on chest radiography and cross-sectional imaging. Children often have concurrent right lung hypoplasia, which alters airway and vascular proportions.

    Scimitar Syndrome (“Scimitar Vein”)

    Recognizing Associated Findings

    In addition to partial anomalous pulmonary venous return, scimitar syndrome often presents with:

    • Hypoplastic right lung
    • Hypoplastic right pulmonary artery
    • Systemic arterial supply to portions of the right lung
    • Bronchial abnormalities, including bronchiectasis

    Scimitar Syndrome with Horseshoe Lung: Hypoplastic right lung, PAPVR to RA, horseshoe lung, R lung bronchiectasis

    One of the most notable associations is horseshoe lung, seen in approximately 80% of cases. Horseshoe lung consists of a parenchymal isthmus connecting both lungs across the midline, usually posterior to the heart. When present, it further reinforces the diagnosis and alerts the radiologist to search for additional congenital anomalies.

    Additional Congenital Abnormalities to Consider

    Although not seen in every case, associated developmental abnormalities may include:

    • Extralobar sequestration
    • Vertebral anomalies
    • Diaphragmatic defects
    • Cardiac malformations

    Their presence can significantly influence management, operative planning, and follow-up.

    Why Does CTA Matter?

    CTA provides the most comprehensive view of the venous drainage pattern, systemic arterial contributions, and bronchial architecture. It allows precise localization of anomalous veins and helps differentiate scimitar syndrome from other types of partial anomalous pulmonary venous return.

    Bottom Line

    Scimitar syndrome is more than an anomalous pulmonary vein. Its constellation of findings—right lung hypoplasia, anomalous venous return, and frequent association with horseshoe lung—requires careful, structured evaluation. CTA remains the best tool to clarify anatomy and guide clinical management.

  • Open-Source AI for Radiology Reporting: Barriers and Practical Workarounds

    Open-Source AI for Radiology Reporting: Barriers and Practical Workarounds

    Large language models (LLMs) are reshaping radiology, but their integration into the reading room is far from straightforward. 2026 ARRS Annual Meeting Categorical Course Director Yee Seng Ng, MD, outlines the most significant barriers to adoption and why the solutions are more complicated than they appear.

    Security Slows Adoption

    Most widely available LLMs live on proprietary cloud platforms. Sending protected health information (PHI) outside a hospital network creates immediate compliance issues, and current guidelines from major organizations explicitly prohibit using public LLMs for protected patient information. Even if models claim not to store or reuse data, rads cannot verify how patient information is handled, refined, or monetized.

    Private Solutions, But Not for All

    Institutions can build private LLM instances behind their firewall, but this requires substantial infrastructure, IT support, and vendor partnerships—resources generally limited to large academic centers. Local installations using open-source models (via interfaces such as webUI) avoid cloud exposure but introduce new challenges: maintenance, computing requirements, and accessibility across the department.

    Where Is NLP Already Helping?

    Even though LLMs aren’t widely used at the point of care, rads are already benefitting from improved natural language processing (NLP) embedded in commercial reporting tools, including

    • Automated impression generation from narrative text
    • Converting freeform dictation into structured reports
    • Organizing sentences under correct headings

    These features accelerate reporting and reduce cognitive load without exposing PHI externally.

    Error Prevention Still Matters

    Simple NLP tools remain some of the most valuable. PowerScribe’s laterality and gender checks prevent avoidable mistakes that can undermine confidence in a report. Tools that flag mismatched anatomy—such as referencing a prostate in a female patient—provide immediate, low-friction safety nets that rads consistently appreciate.


    Bottom Line

    Security and workflow realities remain the biggest obstacles to adopting LLMs for radiology reporting. Until private, institution-controlled LLMs become practical and widely available, rads will continue to rely on integrated NLP tools that improve.

  • Orbital Trauma Reporting: Why Markowitz and Manson Matter

    Orbital Trauma Reporting: Why Markowitz and Manson Matter

    When evaluating orbital trauma, one detail rads should address is the Markowitz and Manson (M&M) classification. As Blair A. Winegar, MD, explains, this system focuses on the degree of comminution in the region of the lacrimal fossa and helps predict whether the medial canthal tendon is likely to be injured.

    Left: Type I, Intact medial canthal tendon connected to single large fracture fragment; Center: Type II, Intact medial canthal tendon connected to single comminuted fracture fragment; Right: Type III, Disrupted medial canthal tendon with severe comminution about the lacrimal fossa

    What M&M Describes

    The key question is whether the lacrimal fossa remains intact or is significantly fragmented.

    • Intact lacrimal fossa: Low likelihood of medial canthal tendon injury.
    • Heavy comminution in the lacrimal fossa: Higher suspicion for medial canthal tendon disruption, which may require surgical repair.

    Why Does It Matter?

    The medial canthal tendon anchors at the anterior lacrimal crest. When that region is fractured extensively, the surgical team needs to prepare for possible tendon repair. Including this observation in your rad report sets appropriate expectations and guides planning for reconstruction.

    Left: Type I; Right: Type II

    Practical Approach

    On CT, evaluate the anterior lacrimal crest and adjacent lacrimal sac fossa.

    Describe whether this region is intact, minimally displaced, or extensively comminuted. Explicitly link substantial comminution to the potential for medial canthal tendon involvement.


    Bottom Line

    In orbital trauma, reporting the Markowitz and Manson classification provides actionable information. Identifying comminution in the lacrimal fossa helps surgeons anticipate medial canthal tendon repair and improves communication between rads and the operative team.

  • Retire? How Is That Going To Go? Pretty Well, Actually.

    Harry Agress, Jr., MD | ARRS Emeritus Member

    Author, Next Years Best Years—Taking Your Retirement to the Next Level 

    Retirement is one of the most unique, fulfilling, and exhilarating opportunities we will ever experience. Yes, I know, some of you may find that hard to believe. So did I, as I saw this major life transition sneaking up over the horizon and then, certainly, as I started to actually live it 10 years ago. 

    Why wouldn’t this be a major concern, a challenge, a mystery. We’ve been working at medicine and radiology for decades—at least since college or before (most of us finished our education/training in 22nd grade). Only a few vocations require this degree of involvement, so seeing it change or end can be a major shock. But have faith—there is more than hope down the line.

    The first big question: “Is it time for me to retire?” There are many factors that determine when we decide, as they say, to put down the stethoscope (that is a piece of instrumentation used before an MRI or PET/CT is ordered). It is deeply personal, involving the interplay of fulfillment, health, finance, stress, and one’s specific life circumstances. Many ask, “What am I going to do in this vast new space?,” “What will give me a sense of purpose?,” and “Will I be able to create new personal connections?”

    The good news is that, as radiologists, we are curious, self-motivated, goal-oriented, and like to learn. Whether you are simply contemplating retirement or are well into it (but need a fresh look at who you are and where you wish to be), one approach to retirement (which I prefer to call “rewirement”) is to ask a few questions, such as:

    • What gives me satisfaction?”—for me; learning, teaching, being creative and productive
    • What am I willing to try (new or reconnecting)?” e.g., writing, volunteering, acting classes, and improving my photography

    Unlike prior generations, our next phase will be a more dynamic and fluid process as it may last a quarter of a lifetime. Therefore, self-awareness becomes extremely important in order to have a truly fulfilling and joyful experience,

    Several things can make our retirement easier. The first is our “Experienced Brain.” We have learned a great deal about medicine, radiology, and life. It is a wonderful thing to pass this knowledge on to residents or medical students. I have loved voluntarily sharing what I have learned with radiology residents because it makes me stay informed and allows me to be engaged with a younger generation. You may want to teach in a totally different field, bringing to mind one physician who became a grade school teacher.

    Another big advantage: If you don’t want to give up imaging entirely, there is always teleradiology, especially if you can set your own level of commitment. As this is still isolating, I would recommend balancing it with other non-medical interests, so that you keep developing and can become part of new communities.

    Suffice it to say that when you are absolved of the responsibilities of work, the things you can explore and accomplish are endless. Plus, there are several other advantages that come with retirement, such as freedom from failure and freedom from comparing ourselves to others. The idea is to dive into new interests just for the sake of trying something different. If it is rewarding, keep going; if it is not, just move onto the next thing. No judgment involved. You may want to get back in touch with passions from your past or think about “What would I have done, had I had not become a physician?”

    You never know where these new forays may take you. My photography ultimately led to something that gave me great satisfaction – donating my prints to hospitals to create a more welcoming and calming environment for patients, their families, and the staff who care for them. (When you are donating, competition goes out the window.)

    So, time to see yourself in a different light and be open to a new, invigorating, and adventure-filled world. Enjoy the journey!


    Dr. Agress retired 10 years ago, following a 36-year practice of diagnostic radiology and nuclear medicine. He continues to voluntarily teach at Columbia Presbyterian and Weill Cornell Medical Centers. You can learn more about Next Years Best Years, his resource for personal and emotional well-being, at NextYearsBestYears.com.