Category: Articles

  • AI Assists in COVID-19 Diagnosis and Prognosis

    AI Assists in COVID-19 Diagnosis and Prognosis

    avatar

    Carlo N. De Cecco

    Associate Professor of Radiology and Biomedical Informatics,

    Division of Cardiothoracic Imaging, Nuclear Medicine and Molecular Imaging

    Department of Radiology and Imaging Sciences, Emory University

    Dr. De Cecco is a consultant for/receives institutional research support from Siemens.

    Published April 22, 2020

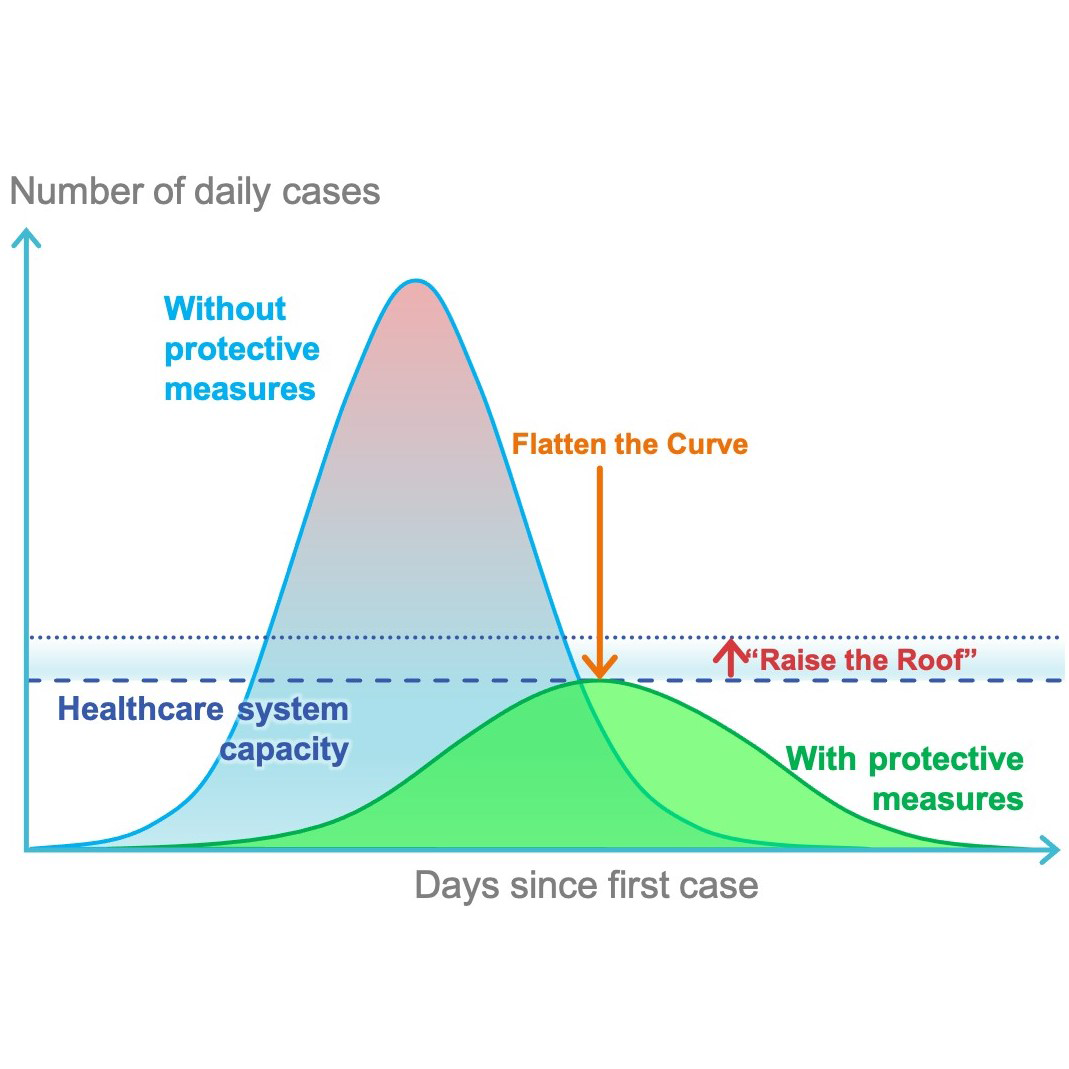
    On January 30, 2020, the 2019 novel coronavirus disease (COVID-19) was declared to be a global health emergency by the World Health Organization. Four months later, the virus is still spreading all over the globe—more than 3.3 million confirmed cases and 235,000 deaths worldwide—with the United States the most affected nation, numbering more than 1.1 million cases and over 65,000 deaths. Dramatic containment measures have been put into place to halt the diffusion of the virus, yet worldwide health care systems are still struggling with the massive influx of COVID-19 patients.

    Currently, reverse transcription–polymerase chain reaction (RT-PCR) serves as the gold standard for the diagnosis of COVID-19. However, chest radiography and CT play an important role in the management of patients affected by COVID-19 from diagnosis to treatment response assessment, depending on the clinical situation and particularly in the early days of the outbreak and in specific geographic areas where RT-PCR tests are not readily available. In these situations, chest radiography as first-line imaging and chest CT in complex cases can provide assistance to clinicians by identifying suspicious findings for COVID-19.Xu Z, Shi L, Wang Y, et al. Case report pathological findings of COVID-19 associated with acute respiratory distress syndrome. Lancet Respir 2020; 8:420–422

    Wong HYF, Lam HYS, Fong AH-T, et al. Frequency and distribution of chest radiographic findings in COVID-19 positive patients. Radiology 2019; 27:201160

    Zhong B-L, Luo W, Li H-MH, et al. Sensitivity of chest CT for COVID-19: comparison to RT-PCR. Lancet 2020; 395:A1–A2

    Lee YP, Jin Y, Fangfang Y, et al. Imaging profile of the COVID-19 infection: radiologic findings and literature review. Radiology 2020 Feb 13 [Epub ahead of print] Besides diagnosis, these images can be used to analyze or predict disease progression and severity. In the long term, chest CT imaging will likely play a role in the follow-up of patients with COVID-19, with possible development of long-term sequela, such as pulmonary fibrosis.

    Artificial intelligence (AI) algorithms applied to patients with confirmed COVID-19 or subjects under investigation offer the potential to develop a more accurate automated approach for early detection and prognostication using the combination of clinical and imaging data. At the moment, several AI solutions are being developed for application in different stages of the COVID-19 diagnostic workflow, from diagnosis to prognosis.

    AI for Classification of COVID-19 Pneumonia

    In the early COVID-19 outbreak, radiographic and CT evaluations have been extensively utilized for diagnostic purposes due to their fast acquisition times. AI can be applied to develop algorithms that quickly learn COVID-19 pulmonary patterns from large datasets, as well as using similar manifestations from other types of pneumonia.

    Radiography-Based AI Classification

    Chest radiography is often used as an initial imaging test. Although generally considered less sensitive than chest CT, chest radiography can provide important information about the pulmonary status of COVID-19 patients, especially in more severe cases. A study by Wong et al. reported that abnormal chest radiographic examinations were found in 69% of patients at admission and 80% of patients at a later time during hospitalizationWong HYF, Lam HYS, Fong AH-T, et al. Frequency and distribution of chest radiographic findings in COVID-19 positive patients. Radiology 2019; 27:201160. COVID-19 presents itself mainly as airspace opacities, ground-glass opacity (GGO), and consolidation at a later stage. Bilateral, peripheral, and lower-zone involvement is observed in 90% of cases, while pleural effusion is rarely described. There are a few AI studies using radiographic images to detect and diagnose COVID-19-related pneumonia from other types of pneumonia and healthy subjects. Wang et al. proposed a deep convolutional network to classify COVID-19-related pneumonia using the largest COVID-19-related database so far, including radiographic examinations in 1,203 healthy patients, 660 patients with viral pneumonia, and 45 patients with COVID-19 Wang L, Wong A. COVID-Net: a tailored deep convolutional neural network design for detection of COVID-19 cases from chest x-ray images. arXiv website. arxiv.org/abs/2003.09871. Published Mar 22, 2020. Updated Apr 15, 2020. Accessed May 7, 2020 . They achieved an overall accuracy of 83.5%. Ghoshal et al. reported the use of a Bayesian convolutional neural COVID-19 classification using 70 chest radiographic images of patients with COVID-19, obtained from an online COVID-19 dataset, and images of patients without COVID-19 obtained from Kaggle’s Pneumonia Chest X-Ray Challenge Ghoshal B, Tucker A. Estimating uncertainty and interpretability in deep learning for coronavirus (COVID-19) detection. arXiv website. arxiv.org/abs/2003.10769. Published Mar 22, 2020. Updated Mar 27, 2020. Accessed May 7, 2020. This study showed heat maps to visualize the locations used by the network to classify COVID-19-related pneumonia, increasing the transparency of the AI process, and they obtained a 92.9% accuracy for severe acute respiratory syndrome coronavirus 2 (SARS-CoV-2) detection.

    From a recent review paper, the overall accuracy of AI-based radiographic algorithms for the classification of COVID-19-related pneumonia was pretty good, ranging between 83.5% and 98% Shi F, Wang J, Shi J, et al. Review of artificial intelligence techniques in imaging data acquisition, segmentation and diagnosis for COVID-19. IEEE Rev Biomed Eng 2020 Apr 16 [Epub ahead of print].

    CT-Based AI Classification

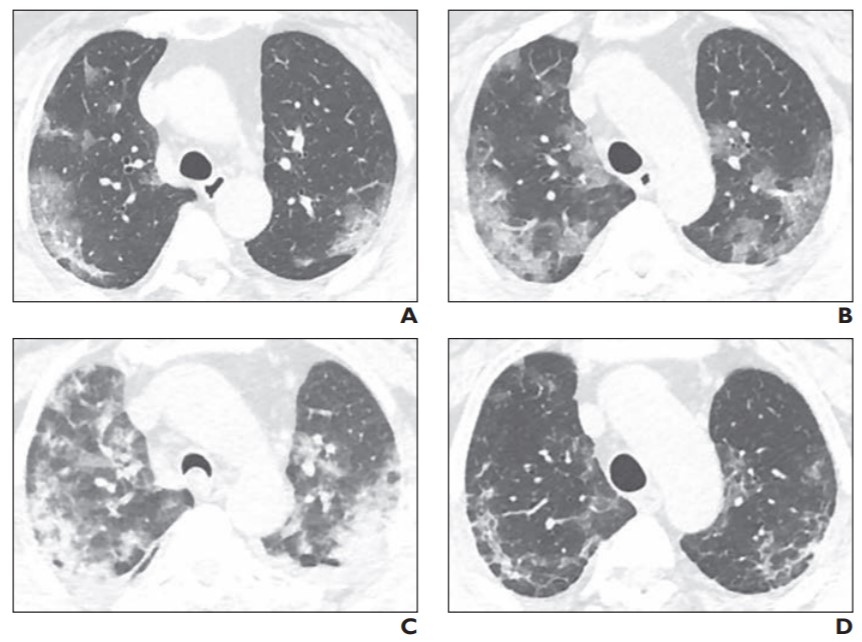
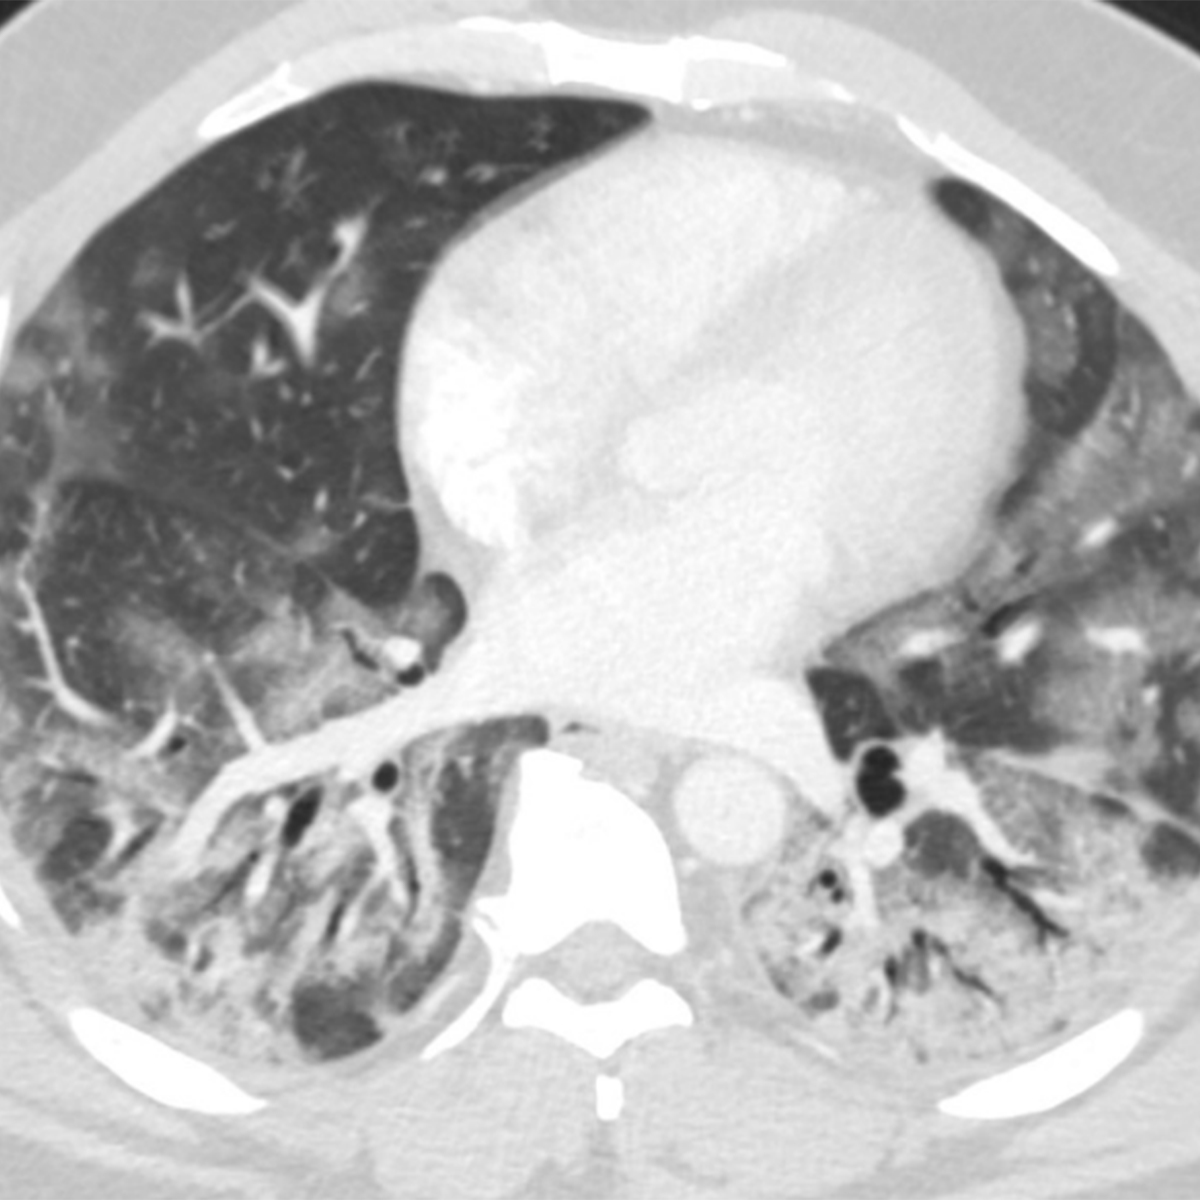
    Chest CT images are considered more sensitive for the visualization of COVID-19-related pulmonary manifestations. Several studies have described radiological chest CT patterns, characterizing different stages of the disease. Early signs of the disease are ground-glass nodules, especially subpleural in the lower lobes, which can be found both unilaterally and bilaterally. In the following stages, diffuse ground-glass nodules, “crazy-paving” pattern, and even consolidation can be found, often bilaterally in distribution encompassing multiple lobes Lee YP, Jin Y, Fangfang Y, et al. Imaging profile of the COVID-19 infection: radiologic findings and literature review. Radiology 2020 Feb 13 [Epub ahead of print]

    Pan F, Ye T, Sun P, et al. Time course of lung changes on chest CT during recovery from 2019 novel coronavirus (COVID-19) pneumonia. Radiology 2020 Feb 13 [Epub ahead of print]

    Bernheim A, Mei X, Huang M, et al. Chest CT findings in coronavirus disease-19 (COVID-19): relationship to duration of infection. Radiology 2020 Feb 20 [Epub ahead of print]
    . At the most severe stage, dense consolidations become more prevalent. At the recovery stage, consolidation patterns are gradually resolved, while GGOs are still present for a longer time.

    Studies on the AI-based classification of COVID-19-related pulmonary manifestations on chest CT are more prevalent than the ones on radiographic images. One of the largest studies performed by Shi et al. Shi F, Xia L, Shan F, et al. Large-scale screening of COVID-19 from community acquired pneumonia using infection size-aware classification. arXiv website. arxiv.org/abs/2003.09860. Published Mar 22, 2020. Accessed May 7, 2020 used chest CT images of 2,685 patients, of which 1,658 patients tested positive for COVID-19, while 1,027 images represented patients with non-COVID-19-related pneumonia. A Size Aware Random Forest method (iSARF) was used to train the algorithm to not only classify the different pneumonia causes, but also segment the image to calculate the involved lung volume. With an accuracy of 87.9%, additionally, their results showed that small volumes have a lower sensitivity for detection. Another large study performed by Li et al. Li L, Qin L, Xu Z, et al. Artificial intelligence distinguishes COVID-19 from community acquired pneumonia on Chest CT. Radiology 2020 Mar 19 [Epub ahead of print] of 4,356 chest CT images (1,296 COVID-19, 1,735 community-acquired pneumonia, and 1,325 non-pneumonia) using a pre-trained deep convolutional network (ResNet50) showed an excellent accuracy rate of 96% for the classification of COVID-19-related pneumonia.

    AI Prediction of Disease Severity and Progression

    With increasing laboratory test availability for COVID-19 diagnosis, the focus of medical imaging is shifting to the assessment of disease severity and disease progression, which can be used for treatment planning optimization and treatment efficiency evaluation Pan F, Ye T, Sun P, et al. Time course of lung changes on chest CT during recovery from 2019 novel coronavirus (COVID-19) pneumonia. Radiology 2020 Feb 13 [Epub ahead of print]

    Bernheim A, Mei X, Huang M, et al. Chest CT findings in coronavirus disease-19 (COVID-19): relationship to duration of infection. Radiology 2020 Feb 20 [Epub ahead of print]

    Zhao W, Zhong Z, Xie X, Yu Q, Liu J. Relation between chest CT findings and clinical conditions of coronavirus disease (COVID-19) pneumonia: a multicenter study. AJR 2020 Feb 19 [Epub ahead of print]

    Li K, Wu J, Wu F, et al. The clinical and chest CT features associated with severe and critical COVID-19 pneumonia. Invest Radiol 2020; 55:1

    Li M, Lei P, Zeng B, et al. Coronavirus disease (COVID-19): spectrum of CT findings and temporal progression of the disease. Acad Radiol 2020; 27:603-608
    . Specific manifestations and affected lung volumes can be used as an indication of disease severity. Tang et al. Tang Z, Zhao W, Xie X, et al. (2020) Severity assessment of coronavirus disease 2019 (COVID-19) using quantitative features from chest CT images. arXiv website. arxiv.org/abs/2003.11988. Published Mar 26, 2020. Accessed May 7, 2020 proposed a random forest model to quantify disease severity using chest CT images of 176 patients with confirmed COVID-19. They reported an accuracy of 87.5% with 0.91 AUC. More interestingly, they showed that specific quantitative features, such as the volume of GGO and its ratio with respect to the whole lung volume, are good indicators of the severity of COVID-19.

    A study by Huang et al. Huang L, Han R, Ai T, et al. Serial quantitative chest CT assessment of COVID-19: deep-learning approach. Radiol Cardiothorac Imaging 2020 Mar 30 [Epub ahead of print] used a deep learning algorithm to automatically quantify CT lung opacification percentage, evaluating longitudinal changes of these quantitative parameters in sequential examinations and taking into account the clinical parameters and disease severity. A total of 126 patients were included, representing mild (6), moderate (94), severe (20), and critical (6) cases. They showed that the opacification progression was mainly present between baseline and first follow up, but not in later stages, and they observed that the opacification percentage increased with worsening disease severity.

    Emory AI Project: The PREDICTION Study

    At Emory University, in collaboration with the Georgia Institute of Technology, we have started an AI project on COVID-19, entitled “Predictive Model of COVID-19 Outcome Using a Convolutional Neural Network Applied to Chest Imaging and Clinical Parameters: Early Detection and Prognostication for Optimal Resource Allocation (COVID-19 PREDICTION Study)” (Fig. 1).

    We have two objectives:

    1. Use supervised learning methods to build a predictive model that can distinguish COVID-19 pneumonia from other common lung pathologies using chest imaging and clinical parameters.
    2. Monitor the disease progression over time detecting different evolution patterns, ideally finding imaging and clinical parameters that can predict the evolution to the most severe cases of COVID-19, which result in intensive care unit admission and the need for respiratory assistance.

    With this project, we hope that an AI-powered solution for COVID-19 early detection and prognostication will have a major impact on patient outcome and optimization of the resource allocation, in particular in areas with limited medical resources and access to ventilators. 

    Fig. 1—Chest radiographic (A) and CT (B) images utilized for training the AI algorithm at Emory University.

    Future Developments and Perspective

    In the near future, more AI-based solutions will be developed and applied for the evaluation of COVID-19 using medical imaging. Whereas the first AI approaches were mostly focused on COVID-19 diagnosis, we now see more algorithms focusing on disease severity and progression quantification. The first step for the development and training of these AI algorithms is the creation of large, representative databases, followed by proper algorithm validation. At the moment, there are several worldwide initiatives for the creation of open-source databases for both radiographic and chest CT images Zhao J, Zhang Y, He X, Xie P. COVID-CT-dataset: a CT scan dataset about COVID-19.  arXiv website. arxiv.org/abs/2003.13865. Published Mar 30, 2020. Accessed May 7, 2020

    Cohen JP, Morrison P, Dao L. COVID-19 Image Data Collection. arXiv website. arxiv.org/abs/2003.11597. Published Mar 25, 2020. Accessed May 7, 2020
    . Recently, the Radiology Society for North America announced a call to develop an open-data repository for international COVID-19 imaging research and education efforts. Creating open-source databases and sharing AI algorithms online offer powerful tools for clinical validation. In the long term, we expect that AI will also play a role in the follow-up of COVID-19, predicting which patients will have permanent damage and assessing the disease evolution.

    The COVID-19 pandemic presents an exceptional challenge for the international health care community. The social impact has been dramatic and will be lasting. Although no country was fully prepared at the beginning of this pandemic, we can now use the lessons learned—together with the large volume of generated clinical data and developing AI techniques—to prepare more efficient global response strategies.

  • From the AJR Files: COVID-19

    From the AJR Files: COVID-19

    avatar

    Patrick M. Colletti

    Professor of Radiology, University of Southern California
    Section Editor for Cardiopulmonary Imaging, AJR

    Published April 2, 2020

    At the time of this writing, the American Journal of Roentgenology (AJR) has received more than 100 manuscripts describing imaging in patients infected with severe acute respiratory syndrome coronavirus 2 (SARS-CoV-2). Thus far, 18 articles and letters have been published online, open-access and ahead-of-print, in the AJR Coronavirus Disease (COVID-19) Collection.

    Ultimately, what should a radiology department do during an infectious disease outbreak? Cheng and colleagues from Singapore General Hospital presented an approach to COVID-19 safety for imagers based on their experience with severe acute respiratory syndrome (SARS) in 2003. They list important actions to be carried over from that experience to protect and optimize radiology department operation:

    Fig. 1—Photograph shows screening station setup at radiology department entrance in early phase of outbreak, including staff member wearing mask. These smaller department-level screening stations were subsequently replaced by larger screening facilities at entrances to each building. Obscuring of facial features has been applied for privacy reasons for publication.
    • Share information so that all team members understand moment-to-moment changes in risks and resources needed to safely manage patients.
    • Personal protection equipment must be made available and properly donned and duffed.
    • Potentially infected patients must be identified and isolated.
    • Ideally, dedicated CT scanners will be identified and managed for high-risk patients.
    • Physical security and access control with proper signage must be assured (Fig. 1).
    • Alternate decentralized work areas should be identified.
    • Interventional radiology procedures should be modified for safety and efficiency.
    • Radiologists must rapidly report potential COVID-19 findings electronically and by telephone conversation, when appropriate.

    So, what’s going on in Singapore today? As of April 14, 2020, there were just over 1,300 active cases of COVID-19 in the country. Of these, 1,287 patients were hospitalized but in stable condition, while 28 were listed as critical. Singapore recorded its 10th death from COVID-19 on April 14.

    Similarly, Hosseiny et al. compared the clinical and imaging findings of COVID-19 with those of two previous coronavirus infections: SARS and Middle East respiratory syndrome (MERS). There are similarities, but there are differences, too. Clinical signs and symptoms of COVID-19 include fever, dyspnea, and dry cough. Complaints of sore throat and diarrhea are less common in most reported cases, though there is substantial variation in presentation other than fever. Typical COVID-19 findings on CT include multilobar ground-glass opacities (GGOs) often with consolidation. Normal CT, as seen in perhaps 15%–20% of scans, does not exclude SARS-CoV-2 infection. As expected, consolidation is an indicator for poor prognosis. Pulmonary fibrotic changes after recovery are less well-described.

    Open Access COVID-19 Resources

    ARRS is committed to providing all radiologists with open access to the latest imaging research on COVID-19 to help understand the imaging features associated with coronavirus.

    In Wuhan, Hubei, China, Han and colleagues described early clinical and CT manifestations of COVID-19 pneumonia. Clinical manifestations in the 108 patients they studied were fever in 94 (87%), dry cough in 65 (60%), and fatigue in 42 (39%) patients. Laboratory findings included normal WBC count in 97 (90%), normal or reduced lymphocytes in 65 (60%), and high-sensitivity C-reactive protein elevation in 107 (99%) patients. CT distribution included one lobe in 38 (35%), two or three lobes in 24 (22%), and four or five lobes in 46 (43%) scans. Most lesions were peripheral (97 [90%]) and patchy (93 [86%]). GGOs were seen in 65 (60%) scans, with consolidation in 44 (41%) scans. The size of opacities varied from less than 1 cm (10 [9%]) to more than 3 cm (56 [52%]). Vascular thickening was noted in 86 (80%), the “crazy-paving” pattern was found in 43 (40%), air bronchograms were seen in 52 (48%), and the halo sign appeared in 69 (64%) CT scans.

    Zhou and colleagues, also in Wuhan, described their findings in 62 patients with COVID-19 pneumonia. They emphasized GGOs and bronchial distortion as signs of COVID-19. Again, as of today, Wuhan seems to be doing well. China has lifted its 76-day lockdown, and the city is reemerging from the coronavirus crisis. From various news reports, you can see that the citizens of Wuhan are wearing protective masks—some of them better than the masks that we have in the United States.

    Meanwhile, in Shanghai, China’s most populous city, Cheng and colleagues pointed out that frontline physicians and radiologists should consider the diverse imaging presentations of COVID-19. A reverse transcription–polymerase chain reaction (RT-PCR) test remains necessary for patients with uncertain imaging findings, and testing is crucial for control of the outbreak—especially during the early period, when patients’ exposure history may be unknown.

    Back in Hubei Province, Li and Xia from Tongji Hospital reported that, from their early experience, CT had a low rate of missed diagnosis of COVID-19 (3.9%, 2/51) and thus, “may be a standard method for the diagnosis of COVID-19 based on CT features.” The co-authors explained further: “Rapid diagnosis can lead to early control of potential transmission. With CT diagnosis of viral pneumonia, patients with suspected disease can be isolated and treated in time so that the management of patients will be optimized, especially for the hospitals or communities lacking nucleic acid testing kits.” They concluded, however, that “for the identification of specific viruses, CT is still limited,” also noting that “it is valuable for radiologists to recognize that the CT findings of COVID-19 overlap with the CT findings of diseases caused by other viruses.”

    From Hunan, China, Zhao et al. reported on the relationship between chest CT findings and clinical conditions of COVID-19 pneumonia in a multicenter study of 101 patients retrospectively collected from four institutions. Most patients, 70%, were 21–50 years old, and 5% of the patients had family outbreaks. Fever was the onset symptom for 78% of patients. Fourteen patients in the emergency group were older than those in the nonemergency group. Most patients with COVID-19 pneumonia had GGOs (87 [86%]) or mixed GGOs and consolidation (65 [64%]), vascular enlargement (72 [71%]), and traction bronchiectasis (53 [52%]). Lesions were more likely peripheral (88 [87%]) and bilateral (83 [82%]) and lower lung predominant (55 [54%]) and multifocal (55 [54%]).

    Salehi and colleagues published a nice systematic review of imaging findings in 919 patients with COVID-19. They concluded that although the majority of COVID-19 mortalities occur among patients with acute respiratory distress syndrome in the ICU, “in a patient population with low pretest probability of [SARS-CoV-2] infection, the typical imaging features should be interpreted with caution.”

    One of the most unique papers AJR has published came from Wuhan. Liu et al. authored a preliminary analysis of the pregnancy and perinatal outcomes of women with COVID-19 pneumonia. Of the 15 pregnant women with chest CT-documented COVID-19, 11 had successful deliveries (10 cesarean, one vaginal) and four were still pregnant (three in the second trimester, one in the third) at the time of publication. Importantly, there were no abortions, neonatal asphyxias, neonatal deaths, stillbirths, or neonatal SARS-CoV-2 infections in any of the newborns. More recently, some papers have confirmed early-onset infection in neonates born to mothers with COVID-19, but mother-to-child transfer was not seen in this initial study of 15 patients.

    Huang et al. in Wuhu, China analyzed 25 patients with RT-PCR-documented COVID-19. CT scores were rated 0–35 based on extent and intensity of lung involvement. Data were separated into two groups, based on time from symptom onset to diagnosis and treatment: group 1 was patients for whom this interval was less than or equal to 3 days and group 2 was those for whom the interval was greater than 3 days). CT scores were plotted against time, and after analyzing the resulting curves, the mean peak CT score was 10 and 16 for group 1 and 2, respectively, and the mean time to disease resolution was 6 and 13 days, respectively. The last CT scores were lower for group 1 than for group 2 (p = 0.025), which led to the conclusion that timely diagnosis and treatments are keys to providing a better prognosis for patients with COVID-19.

    In early encounters with COVID-19 pneumonia, typical chest CT findings created the impression that CT could successfully screen for infected patients (Fig. 2).

    Fig. 2—59-year-old woman with coronavirus disease (COVID-19).
    A, Initial unenhanced axial chest CT image 4 days after admission shows multiple bilateral subsegmental peripheral patchy and ground-glass opacities with obscure boundaries and mainly subpleural distribution. Neither pleural effusion nor enlarged mediastinal lymph nodes are seen.
    B and C, Unenhanced axial CT images 6 (B) and 12 (C) days after admission and after initiation of treatment shows enlarged lesions; lesions of both lungs are diffuse and patchy compared with previous CT images (A).
    D, Unenhanced axial CT image 22 days after admission shows lesions in both lungs have absorbed gradually after treatment, and subpleural line can be seen.

    On occasion, CT imaging showed asymptomatic opacities while RT-PCR testing was negative. As experiences with less-enriched COVID-19 cohorts were encountered, we learned that CT was considerably less efficient at detecting the many asymptomatic patients with COVID-19, especially compared with nucleic acid testing.

    Logically, asymptomatic community members do not require RT-PCR testing unless there has been a known or potential exposure to COVID-19. CT is best reserved in planning therapy on selected patients with symptomatic COVID-19, or if doctors have reasonable suspicion that RT-PCR is falsely negative.

    Of course, whereas the findings of CT lung opacities typical for COVID-19 may appear to be statistically reliable in the early stages of a pandemic, alternative diagnoses, including other infections and inflammatory conditions, cannot be readily excluded by image pattern alone.

    As the newest article in AJR’s Coronavirus Disease Collection by Raptis and colleagues makes clear, “the radiology literature on COVID-19 has consisted of limited retrospective studies that do not substantiate the use of CT as a diagnostic test for COVID-19.”

  • Responding to a Pandemic MCI

    Responding to a Pandemic MCI

    avatar

    Mark P. Bernstein

    Clinical Associate Professor, Trauma & Emergency Radiology
    NYU Langone Health, Bellevue Hospital

    avatar

    Eric A. Roberge

    Assistant Professor of Radiology
    Uniformed Services University of the Health Sciences

    avatar

    Suzanne Chong

    Associate Professor, Emergency Radiology Division, Radiology and Imaging Sciences Department
    Indiana University Health

    Published April 20, 2020

    Mark P. Bernstein’s “Mass Casualty Incidents: An Introduction for Imagers” was published in the Winter 2020 issue of ARRS’  InPractice magazine. Below, Bernstein et al. provide a primer for hospitals and health care systems responding to the disaster surge of COVID-19.

    The coronavirus disease (COVID-19) pandemic has created a mass casualty disaster of staggering proportions. By April 2020, the novel coronavirus responsible for COVID-19 had forced many parts of the United States into crisis mode, while others race to prepare for the inevitable. In regions where the case numbers have not yet begun to climb, disaster planning teams have time to prepare for a crisis response and implement lessons learned from those who were impacted earlier. The goal is the greatest good for the greatest number of people, so hospitals and health care systems are turning the focus from individual health to population health in their disaster surge response to save as many lives as possible.    

    Mass casualty incidents (MCIs) can be man-made acts of violence, such as mass shootings, bioterrorism, or exploding bridges, or natural disasters in the form of earthquakes, tornados, tsunamis, and pandemics. Tragedies of intentional violence or infrastructure disasters create a sudden surge, demanding a rapid shift in a hospital’s daily routine, and are usually limited geographically—for example, the site of an active shooter or a train derailment. Natural disasters, however, cover much larger regions (i.e., the path of a tornado), whereas, by definition, pandemics know no boundaries.

    One key variable in these disasters is time. Time, in most cases, determines our ability to prepare for and maintain a disaster response. In trauma MCIs, there is a window of time when patients arrive to local hospitals, which is often measured in minutes to hours. In the case of bioterrorism or pandemics, timelines are prolonged, measured in days to weeks. Regarding the ongoing COVID-19 pandemic, the window of time is indefinite and unknown. The disruption of a hospital’s daily routine for prolonged periods of time and the need for resources beyond those available, or worse, outstrips the supply chain, placing severe strain on the health care system. Our best tools to manage these challenges are preparation, planning, and practice.  

    Preparation and planning take place from the federal and state levels to the community and local health care facility levels. Community planning should be coordinated with local governmental agencies, in accordance with state and federal disaster planning efforts, and integrated with local public health and emergency medical services. With respect to pandemics, community strategies must make every effort to “flatten the curve” in order to break the chain of transmission and slow the spread of infections. At the same time, hospital system strategies “raise the roof” of surge response by increasing health care system capacity (Fig. 1) through predesigned efforts focused on three factors: space, staff, and supplies. The hospital system is the backbone of these three elements.  

    Figure 1 – Community efforts to “flatten the curve” of coronavirus infections often intersect with health care system strategies to “raise the roof” for patient capacity (modified from Disaster Med Public Health Prep with permission from the Society for Disaster Medicine and Public Health).

    Strategies for increasing health care system capacity will include conservation and substitution during a conventional response, adaptation and recycling during a contingency response, and, finally, reallocation of resources during a crisis response—essentially, withholding resources from one patient population to use them more effectively on another patient population. These “raise the roof” strategies involve nuanced ethical and legal considerations that must be addressed in advance, authorized by hospital leadership, and communicated clearly to frontline health care workers.

    System

    Ultimately, the hospital system component directs the response that determines the allocation of the three critical resources of space, staff, and stuff, which are based on supply and demand.

    A robust hospital incident command system provides broad management for a multitude of issues, including: hospital controls (facility access, ventilation), communication (internal and external), community coordination (health care facilities, state and federal agencies, as well as utilities and supply chains), and continuity of emergency health care operation (vis-à-vis utility or other system failures). The hospital incident command should also determine and communicate which disaster response is being utilized. Disaster response can be described, in escalating intensity, as conventional, contingency, and crisis, dependent on surge severity and resource availability. The more severe the surge, the fewer the resources; the lower the hospital’s capacity to take care of victims, the more quickly the disaster response must shift into a higher mode (Fig. 2). 

    Space

    Upon declaration of an MCI, efforts must be made to free up physical space for patients. The size and nature of the disaster will dictate the scope and speed necessary. 

    Figure 2 – As the hospital incident command system escalates the intensity of disaster response—from conventional to contingency to MCI—the minimum acceptable standard of care for patients is diminished (modified from Disaster Med Public Health Prep with permission from the Society for Disaster Medicine and Public Health).

    The conventional response is for surges causing a 20% increase in patients beyond normal capacity. In this situation, all staffed beds are made available and filled. Elective procedures are postponed or cancelled, and patient discharge plans are activated to dedicate more space and empty beds to the surge.

    A contingency response is used for surges that are twice a hospital’s capacity and demands more aggressive actions. As the numbers of patients greatly exceed the available hospital and critical care beds, hospital spaces designed for other purposes, including step-down units, observation units, and procedure suites, can be repurposed to recruit more space to bed patients. Transferring patients to other available facilities for ongoing, nonemergent care can be initiated.

    A crisis situation completely overwhelms a health care facility. Patients fill hallways, and makeshift spaces, such as tents and offices, need to be devised. Erecting tent hospitals with intensive care units in city parks, converting convention centers into field hospitals, and docking of the United States Naval Ship (USNS) Comfort in Manhattan and USNS Mercy in Los Angeles are evidence that our nation is in crisis because of the COVID-19 pandemic.

    Staff

    As more space becomes available, achieving appropriate staffing and obtaining adequate supplies for the surge of patients is vital. The hospital incident command system should be convened for action as soon as a disaster is declared to urgently alert and mobilize necessary staff. The type of injuries that are expected (e.g., blunt trauma, penetrating trauma, or biological agent) will determine the type of staff best suited to respond. If staffing levels are insufficient, measures to increase staffing may be warranted, including expanding the scope of responsibilities, lengthening shifts, and enlarging patient-to-nurse ratios.  

    In a conventional response, trained and credentialed staff are able to care for patients with minor modifications, while maintaining usual standards of care.

    The standard of care is challenged in a contingency response, as adequately trained staff must train and supervise off-service staff to safely provide care. Bringing in additional staff should be considered, and outside staff need to be given emergency privileges and credentialing.     

    A crisis response demands staff to perform clinical functions outside their usual domain. Aggressive staff recruitment and rapid training are necessary to meet the patient care demands and volume. During crisis mode, triage becomes necessary to ensure that acceptable care is provided for the largest number of people. Over- and under-triage can result in higher mortality rates. 

    Supplies (“Stuff”)

    Supplies include medications, medical equipment, and personal protective equipment (PPE). Considerations must also be made for laboratory reagents, diagnostic testing, as well as for food, water, and linens.

    The hospital system must be aware of onsite and offsite supply storage and availability through supply chains. The ability to adapt, reuse, and reallocate becomes necessary in both contingency and crisis situations.

    In the current COVID-19 pandemic, we are witnessing contingency and crisis responses. Hospitals are experiencing severe shortages of ventilators and PPE, meaning patients may be deprived of life-saving care and health care providers are likely to be infected with dire, cascading ramifications.

    Radiology Department Response

    A departmental incident command team should be in place to implement a disaster management plan and engage in clear and consistent communication. The radiology department must have containment and mitigation strategies that ensure the safety of all staff and patients being imaged. For COVID-19, these measures include ensuring adequate PPE, especially for frontline technicians performing imaging studies, enforcing physical distancing, and limiting in-person interactions. Remote reading should be instituted, where possible. Decontamination protocols must be defined and executed. Nonemergent studies should be halted, including interventional procedures, to preserve PPE and limit exposure.

    All real-time changes to address incident-specific issues should be frequently updated and communicated. Implementing these types of measures allows radiology departments to provide safe and appropriate care during surges and helps to ensure sustainable operations.

    The lessons we learn from responses nationally and internationally should be incorporated into our hospital and departmental MCI and disaster planning process. Our ability to plan and prepare by focusing on system, space, staff, and stuff will make all the difference in the number of lives saved.

    Suggested Reading

    1. Christian MD, Devereaux AV, Dichter JR, Rubinson L, Kissoon N. Introduction and executive summary: care of the critically ill and injured during pandemics and disasters: CHEST consensus statement. Chest 2014; 146:8S–34S
    2. Institute of Medicine (US) Committee on Guidance for Establishing Crisis Standards of Care for Use in Disaster Situations; Altevogt BM, Stroud C, Hanson SL, Hanfling D, Gostin LO, eds. Guidance for establishing crisis standards of care for use in disaster situations: a letter report. Washington, DC: The National Academies Press, 2009
    3. Institute of Medicine (US) Committee on Guidance for Establishing Crisis Standards of Care for Use in Disaster Situations; Hanfling D, Altevogt BM, Viswanathan K, Gostin LO, eds. Crisis standards of care: a systems framework for catastrophic disaster response. Washington, DC: The National Academies Press, 2012
    4. Institute of Medicine (US) Committee on Crisis Standards of Care: A Toolkit for Indicators and Triggers; Hanfling D, Hick J, Stroud C, eds. Crisis standards of care: a toolkit for indicators and triggers. Washington, DC: The National Academies Press (US), 2013

    The views expressed are those of the authors and do not reflect the official policy of the Department of the Army, the Department of Defense, or the U.S. Government.

  • Board Certification: An Important Marker

    Board Certification: An Important Marker

    avatar

    N. Reed Dunnick

    Associate Executive Director Diagnostic Radiology
    American Board of Radiology

    Published April 10, 2020

    Along with the Radiological Society of North America, American College of Radiology, American Radium Society, and American Medical Association Section on Radiology, the American Roentgen Ray Society (ARRS) co-sponsored the founding of the American Board of Radiology (ABR) in 1934. The mission of the ABR is to certify that our diplomates have demonstrated and maintained the requisite knowledge, skill, and understanding of their disciplines for the benefit of their patients.

    Board certification serves as an important marker for the highest standard of care. It reflects the critical core values of compassion, patient-centeredness, and a commitment to life-long learning. Patients, physicians, medical physicists, health care providers, insurers, and quality organizations look for board certification as the best measure of a physician’s or medical physicist’s knowledge, experience, and skills to provide quality care within a given specialty.

    Board certification and participation in a maintenance of certification (MOC) program has many benefits. It assures patients, privileging committees, payers, and regulators that the physician has successfully completed a training program and continues to expand his or her medical knowledge, which leads to improvements in their practice and patient safety. In 2007, the ABR instituted a requirement for practice quality improvement projects, which must be relevant to one’s practice, achievable, provide measurable results, and likely to improve quality. This remains a major component of the MOC program. Over the years, the number of qualified projects and participatory activities has been greatly expanded to reflect the integration of radiologists into the health care system.

    Meet your MOC Requirements
    Leverage these member-exclusive benefits to meet your educational requirements with the ABR.

    Since the founding of the ABR in 1934, the field of radiology has grown dramatically, and it became increasingly difficult to master the entire field. Thus, separate residency training programs were developed for diagnostic radiology and radiation oncology. (Most recently, a primary residency for interventional radiology has been approved.) Continued advances and the development of new imaging modalities resulted in many diagnostic radiologists restricting their practice domains to some extent. The ABR responded by providing subspecialty certification to reflect the importance of subspecialization. Subspecialty certification was offered for pediatric radiology and vascular and interventional radiology in 1994, for neuroradiology in 1995, and nuclear radiology in 1999. Given the speed with which these many advances in medical science changed the field of radiology, it became apparent that remote board certification was no longer pertinent. Something was needed to assure the public that physicians were keeping up with these new developments. The four subspecialty certificates offered by the ABR were timelimited from their inception, and the last lifetime primary certificates issued by the ABR were given in 2001. MOC would now be required to maintain ABR certification for all but lifetime certificate holders.

    The four components of MOC are:

    1. professionalism and professional standing
    2. life-long learning and self-assessment
    3. assessment of knowledge, judgment, and skills and
    4. improvement in medical practice.

    Originally, these requirements were met by maintaining an unrestricted state medical license in each state of practice, participating in continuing medical education that includes self-assessment, a cognitive exam, and participation in quality improvement projects. The ABR MOC requirements have been modified over the years, based on feedback from our diplomates.

    Initially, a cognitive exam was required to satisfy Part 3 for MOC participants. However, this required radiologists to take time away from their practices and to pay for expenses to travel to a testing center. Furthermore, the cognitive assessment was required only every 10 years, an interval that many considered too long. An improved program was needed that would be meaningful, but not onerous for the diplomates.

    The ABR Online Longitudinal Assessment (OLA) was introduced for diagnostic radiology in 2019, and for interventional radiology, radiation oncology, and medical physics in 2020. Each week, participating diplomates receive an email giving them the opportunity to answer one or two questions. Most diplomates are required to answer 52 questions a year. (Some with multiple certificates are required to answer more questions.) These questions were designed to test “walking around knowledge”—information diplomates should know “off the top of their head,” if asked by a colleague, resident, or patient. Furthermore, it is a learning experience, as the rationale for the correct answers and a reference is provided immediately.

    Reaction to OLA has largely been positive. Many radiologists enjoy receiving two questions every week in their selected areas of practice. Since the “shelf life” of a question is four weeks, diplomates can elect to answer eight questions every four weeks, if they prefer “batching” the questions rather than answering two questions every week. Most radiologists have enjoyed participating in OLA, as it takes only a few minutes each week and does not require travel. Many continue to answer the weekly questions even after completing their yearly requirement of 52 items. More than 20,000 radiologists are now actively participating in MOC.

    Questions for all ABR examinations are written by volunteers and reviewed by a subspecialty committee, before being submitted to be included in the cognitive assessment. The next step is the test assembly meetings, where all questions are again reviewed. Despite this rigorous process, an occasional problematic question may appear on an examination. These are picked up when ABR staff review the results of the exam. The ABR is fortunate to have two psychometricians and multiple experienced exam developers on staff, who review any potentially questionable item. Often, problematic questions are referred to a radiologist member of the Board of Trustees or the appropriate Committee Chair to participate in the decision whether to keep or remove the item from examination scoring.

    ABR OLA Webinar

    Hear directly from ABR leadership as they provide an overview of the new ABR OLA program, which replaces the every ten-year MOC exam.

    The ABR is a non-profit organization, which is highly dependent upon its many volunteers. The ABR has more than 900 diagnostic radiologists serving as volunteers on 68 different committees. Most of the paid office staff live in the Tucson, Arizona area and work at the ABR office building. Volunteers do much of their work electronically, but they do have periodic committee meetings in the Chicago testing center, near O’Hare airport, or at ABR headquarters in Tucson.

    The volunteers contribute their time and expertise in writing questions, reviewing them for image quality and appropriateness as well as for constructing examinations. Before an examination is administered, another group of volunteers sets the passing standard (cutscore) using the Angoff Method. The Angoff Method is done by having a group of subject matter experts— many of whom are residency program directors—evaluate each item to estimate the proportion of minimally competent candidates who would correctly answer the item. The cutscore is the score that the panel estimates a minimally qualified candidate would receive. This is the legally defensible method used for many high-stakes examinations in the United States.

    The goal of the ABR is to conduct examinations in which the candidates are comfortable and can do their best in demonstrating their knowledge. Thus, videos have been created to demonstrate the examination experience in both Chicago and Tucson. The ABR also communicates with their diplomates, candidates for certification, and the public through a variety of other means. The ABR has a booth at several of the larger radiology meetings to provide in-person answers and advice to attendees. The BEAM is the ABR’s newsletter that has recently increased from three to six issues a year. The ABR’s blog received more than 23,000 views last year. Additional communication efforts, which began in November 2018, include the social media outlets of Facebook, Twitter, Instagram, and LinkedIn.

    The American Board of Radiology, along with the other 23 American Board of Medical Specialty member boards, strives to advance our field, improve patient care, and protect the public by assuring that our diplomates have acquired and maintained the requisite knowledge and skills to be effective practitioners. Board certification is an important marker of those attributes.

  • An Emergency Radiologist’s Perspective on Traumatic Vascular Injuries

    An Emergency Radiologist’s Perspective on Traumatic Vascular Injuries

    avatar

    Claire K. Sandstrom

    Associate Professor, Emergency Radiology
    University of Washington

    Published April 23, 2020

    Advancements in the accessibility, speed, and image quality of MDCT in the last 20 years have guaranteed that MDCT is the preferred imaging modality for evaluation of most conditions presenting in the emergency department, and this is particularly true for imaging after trauma. Vascular injuries, including those involving the thoracic and abdominal aorta, abdominal mesentery, pelvis, cervical vessels, and upper and lower extremities, are an uncommon but potentially lethal outcome of both penetrating and blunt trauma. Historically, diagnosis of vascular injuries relied on open exploration or conventional catheter-based angiography (CTA), both of which are invasive, time-consuming, and not broadly accessible. Today, however, the diagnosis or exclusion of many of these injuries is made on MDCT, oftentimes obviating the need for more invasive techniques. The timing and type of endovascular repair, particularly for aortic injuries, has also evolved.

    Most deaths from traumatic aortic injuries still occur at the scene or before the patient reaches the hospital. However, those who reach the emergency department and undergo imaging can now be treated with a high rate of success. The majority of traumatic thoracic aortic injuries (TTAI) are found at the aortic isthmus. Injuries are found less commonly at the aortic root, ascending aorta, distal descending aorta, or at branch vessel origins, with multifocal injuries in up to 18% of patients. Although most aortic injuries are associated with high-energy trauma, there is no consensus as to the precise definition of “high-energy.” Furthermore, direct chest trauma or visible external signs of chest trauma are not necessary for the diagnosis. Therefore, liberal screening with chest CTA is encouraged in any patient with more than minimal deceleration injury.

    Initial screening for mediastinal hematoma may be performed with a portable chest radiograph in many institutions. Signs suggesting mediastinal hematoma, and thus raising the possibility of a surgically relevant aortic injury, include right paratracheal stripe thickening, superior mediastinal widening, aortic arch enlargement or irregularity, opacification of the aortopulmonary window, rightward displacement of the trachea or enteric tube, inferior displacement of the left mainstem bronchus, obscuration of the descending aorta, widening of the paraspinal lines, or apical capping. These radiographic features are neither sensitive nor specific, and absence should not preclude chest CTA in high-risk trauma victims. Contrast-enhanced chest MDCT has very high sensitivity and a negative predictive value for acute aortic injuries, and it should be obtained in all at risk patients. Thoracic CTA with cardiac gating or ultrahigh pitch is the diagnostic study of choice, but nongated CTA is sufficient in most patients. Intimal flaps, intraluminal thrombus, intramural hematoma, irregular external aortic contour, focal luminal dilation or saccular outpouching (also known as pseudoaneurysm), or active extravasation are direct signs of aortic injury. Injuries can be graded according to the Society of Vascular Surgery (SVS) system or using a newer system of minimal/moderate/severe injuries that more directly guides management. Minimal aortic injuries have no external aortic contour deformity and intimal tear or intraluminal thrombus less than 10 mm in size (equivalent to SVS grade 1); these injuries do not require operative intervention and instead receive antiplatelet therapy for 4–6 weeks, with optional follow-up imaging. Moderate and severe TTAIs require surgical intervention.

    Between 2002 and 2014, mortality from blunt TTAI decreased from 46.1% to 23.7%, largely as a result of increased use of endovascular rather than open repair. One important recent trend in the management of TTAI involves timing of intervention. Although the risk for rupture of contained TTAI is highest in the first 24 hours, mortality rates and rates of paraplegia and stroke are lower when repair is delayed until after the overall condition of the patient can be stabilized. For all but the most severe aortic injuries—those with active extravasation or a very large contained rupture with large periaortic hematoma—repair is performed in 1–3 days, when the patient’s condition is more stable and concomitant injuries are considered survivable. In the interim, antihypertensives are used to reduce wall stress and risk of rupture.

    Only about 5% of blunt aortic injuries involve the abdominal aorta. Sufficiently rare that many radiologists may never encounter one during their careers, this injury should be specifically sought when patients present with blunt abdominal trauma, such as a seatbelt sign or abdominal impact on the steering wheel, and have spinal fractures (particularly flexion-distraction injuries), duodenal or small bowel injuries, or pancreatic injuries. Isolated blunt abdominal aortic injuries (BAAI) are also rare. Two-thirds of BAAIs occur between the renal arteries and the aortic bifurcation, and up to one-quarter also have injuries involving the thoracic aorta. Abdominal CTA is the diagnostic study of choice, though venous-phase abdominal MDCT is sufficient for diagnosis and preintervention planning in most cases. In patients stable enough to be evaluated on MDCT, the most common appearance of BAAI is intimal flaps or intimal thrombi without external aortic contour deformity. Pseudoaneurysms of the abdominal aorta are only seen in 16% but require repair, either open or endovascular, depending on location. In the absence of external contour abnormality, BAAI can be managed nonoperatively with antiplatelet therapy and beta blockers. It is important to note that neither TTAI or BAAI can be excluded on a unenhanced CT because injuries, particularly intraluminal thrombi and intimal flaps, may not be accompanied by periaortic hematoma or stranding.

    Injuries of the mesenteric vasculature are also uncommon in blunt trauma patients, more often resulting from penetrating trauma. Unfortunately, these are frequently lethal due to exsanguination, reflecting the difficulty in obtaining control of the proximal superior mesenteric artery (SMA), as well as back-bleeding from the valveless portomesenteric venous system. Though uncommon at initial laparotomy, bowel infarction and subsequent sepsis and multiple organ system failure are responsible for the bulk of delayed deaths from mesenteric vascular injury. Classification systems by the American Association for the Surgery of Trauma-Organ Injury Scale (AAST-OIS) and by Fullen et al. are both anatomy-based, reflecting the greater surgical difficulty and poorer outcomes associated with more proximal mesenteric arterial or venous injuries. Although immediate operative evaluation is appropriate in any patient with penetrating trauma to the peritoneum or with blunt trauma in extremis, patients with hemodynamic stability following blunt abdominal trauma can be imaged with contrast-enhanced MDCT. On MDCT, direct signs of surgically important mesenteric vascular injuries include mesenteric vascular beading, abrupt termination, or active extravasation. Intraperitoneal low- or intermediate-density free fluid is highly sensitive for either bowel or mesenteric injury, as is abnormal bowel wall thickening or enhancement, and surgical exploration is appropriate when any of these are found on MDCT. The absence of intraperitoneal free fluid has a high negative predictive value for surgically important mesenteric or bowel injury. Isolated mesenteric stranding or hematoma without active extravasation does not necessarily need surgical exploration, but these patients should be monitored carefully for delayed presentation of CT-occult bowel injury or mesenteric injury resulting in bowel ischemia.

    Hemorrhage from pelvic ring injuries can be significant and life-threatening. Arterial hemorrhage accounts for 15–20% of pelvic bleeding, and low-pressure bleeding from venous structures or fractured edges of cancellous bone account for the remainder. These low-pressure bleeding sites are usually controlled by pelvic sheeting, external fixation, or internal pelvic packing, whereas arterial hemorrhage is amenable to endovascular control. Early triage to angiography may be considered for those patients with obturator ring fractures displaced at least 1 cm or pubic symphyseal diastasis of at least 1 cm, as these are independent predictors of major hemorrhage. If a patient with pelvic ring injuries is hemodynamically stable, multiphase MDCT can improve the sensitivity and specificity of detection of pelvic bleeding. Ideally, an arterial phase is obtained to identify arterial injury, as opposed to venous injury, and an additional phase differentiates active bleeding from pseudoaneurysm. Unenhanced MDCT or dual-energy CT with virtual unenhanced images may be necessary to identify bone fragments that mimic pseudoaneurysm or active extravasation. Absence of contrast extravasation on MDCT has a high negative predictive value for clinically significant pelvic bleeding. When conventional catheter-based pelvic angiography is performed, whether before or after MDCT, injection of the bilateral internal iliac veins and the bilateral external iliac veins should be performed.

    Most peripheral vascular traumatic injuries result from penetrating trauma in civilian or military settings and involve the femoral or popliteal arteries of the lower extremity. Following blunt trauma, popliteal arterial injuries are found in 30% of knee dislocations, as well as accompanying some displaced femoral or tibial plateau fractures. Open mid-shaft tibial and fibular fractures commonly have injuries to the anterior and posterior tibial arteries. Although traumatic injuries of the torso usually take precedence over extremity injuries, active extremity bleeding may require direct pressure, tourniquet, or direct clamping to prevent life-threatening hemorrhage. Potential complications of peripheral vascular trauma include exsanguination, acute ischemia, tissue necrosis, reperfusion injury, and need for amputation. Thus, prompt diagnosis and treatment of peripheral vascular injuries aims to prevent life-threatening blood loss and restore perfusion to the extremity, with increased likelihood of limb salvage, if definitive treatment is performed within 6 hours.

    Lower extremity CTA is the diagnostic study of choice for noninvasive evaluation of lower extremity vascular trauma. Any patient with hard signs of vascular trauma, including active hemorrhage, an expanding or pulsatile hematoma, a wound with bruit or thrill, a distal pulse deficit, or distal ischemic changes, should undergo CTA, unless emergency surgical intervention is necessary. Even those with lower extremity injuries, without hard signs of vascular injury, may still benefit from lower extremity CTA if the ankle-brachial index (ABI) is reduced below 0.9 (sensitivity 87–100%, specificity 80–100%). For those with ABI above 0.9, the likelihood of vascular injury requiring surgery is low, though these patients may still be observed with serial exams for 24–48 hours. One important protocol issue with lower extremity CTA on newer ultrafast scanners is that the scan may “outrun” the contrast bolus in the distal lower extremity, particularly in patients with lower cardiac output. For this reason, at my institution, our lower extremity CTA protocol includes the arterial phase from abdomen or pelvis through the toes, followed 7 seconds later by an immediate delayed (late arterial) phase from knees to toes. Inclusion of both lower extremities in the reconstructed FOV is helpful, even if the injury is unilateral, to provide internal comparison.

    Upper extremity CTA is less commonly performed and is more variable in technique. If the upper extremity CTA is performed in isolation, the arm may be positioned above the patient’s head to improve image quality and reduce radiation dose, as long as the patient’s injuries permit such positioning, whereas if the CTA is performed concurrent with a chest CTA, the arm can be positioned at the patient’s side. Always consider contrast injection contralateral to the injured arm to avoid a nondiagnostic scan because of venous extravasation or extensive streak artifact. If both upper extremities require evaluation, a central line should be used for contrast injection. Furthermore, the suspected location of vascular injury may affect the scan range. Proximal injuries, such as those from scapulothoracic dissociation, may only require evaluation of the upper arm to the level of the elbow. If more distal evaluation of the forearm, hand, or fingers is required, some advocate a two-part CTA protocol with different energies and fields of view (100–120kV for aortic arch to elbow, small field of view and 80–100kV for elbow to fingertips, when elbow is positioned above the head).

    CTA findings of vascular injury in the upper and lower extremities requiring intervention include vascular occlusion, dissection, extravasation, transection, pseudoaneurysm, and arteriovenous fistula. Differential considerations include preexisting peripheral arterial atherosclerotic disease, nonocclusive vascular spasm, extrinsic compression from adjacent bone fragments or compartment syndrome, or acute embolic occlusion, such as from proximal aortic injury.

    Vascular trauma requires prompt recognition and appropriate treatment to prevent significant mortality or morbidity. Today, MDCT is by far the most common technique by which these injuries are diagnosed following trauma. Since vascular injuries are uncommon, many radiologists might not feel adept at imaging them, recognizing them, and characterizing them. It is imperative that an arterial phase MDCT protocol be developed for use in high-risk patients, that intravenous contrast be used in all cases, and that suspicious imaging findings are conveyed to the trauma team appropriately and urgently. These patients may benefit from referral to a level 1 trauma center for definitive treatment.


    The opinions expressed in InPractice magazine are those of the author(s); they do not necessarily reflect the viewpoint or position of the editors, reviewers, or publisher.

  • The Evolution of Thyroid Cancer Theranostics

    The Evolution of Thyroid Cancer Theranostics

    avatar

    Arif Sheikh

    Senior Faculty, Icahn School of Medicine
    Mount Sinai Hospital

    avatar

    Leonie Gordon

    Vice Chair of Education Professor of Radiology and Nuclear Medicine
    Medical University of South Carolina

    avatar

    Don C. Yoo

    Professor of Diagnostic Imaging, Clinician Educator, Warren Alpert Medical School of Brown University
    Director of Nuclear Medicine, Miriam Hospital

    avatar

    Esma Akin

    Associate Professor of Radiology, Chief of Division of Nuclear Medicine
    George Washington University Medical Center

    avatar

    Katherine Zukotynski

    Departments of Medicine and Radiology
    McMaster University

    Published March 23, 2020

    Theranostics is an exciting, emerging field where imaging and therapy are intimately tied together, as the same chemical molecule is used for imaging and therapy with a different radionuclide. Theranostics is a relatively new word, but radioiodine ablation with Iodine-131 (I-131) for imaging and treatment of thyroid cancer is one of the earliest examples of theranostics. Although radioactive iodine (RAI) has been used in clinical practice since the second world war, advances in imaging, therapeutic agents, and our understanding of the molecular basis of disease has slowly led to change. Developing a standardized approach to the management of thyroid cancer has been challenging and controversial. The American Thyroid Association (ATA) and the National Comprehensive Cancer Network (NCCN) guidelines for the management of thyroid cancer have undergone several iterations, some of which have been controversial, as conclusive data on the use of imaging and management strategies is often limited. Recently, however, discussion has led to the publication of the Martinique principles—setting the stage for increased interdisciplinary communication in an attempt to establish a set of recommendations based on the existing data and our wealth of accumulated experience.

    Today, when a patient is diagnosed with thyroid cancer, they are assessed clinically and stratified as low, intermediate, or high risk. This is commonly done using the ATA or NCCN risk stratification system for recurrence, and the American Joint Committee on Cancer staging system predictions for long-term outcomes. Based on the risk stratification, a management plan is devised. Often, this includes pre-therapy imaging, therapy, and post-therapy imaging. There is a host of imaging that may be performed before and after therapy. Most commonly, ultrasound, CT, and planar imaging using RAI are performed with a gamma camera; however, SPECT and SPECT combined with CT may improve the sensitivity and specificity for the detection of disease compared with planar imaging alone. PET either with CT or MRI has a role for patients suspected of having thyroid cancer recurrence with rising thyroglobulin and negative diagnostic thyroid scans. There are several radioactive agents to choose from for imaging purposes. Although I-131 is typically less expensive and may be used for both imaging and therapy, Iodine-123 (I-123) has better imaging characteristics and is often used for diagnostic scans, especially in low- or intermediate-risk patients; however, I-123 cannot be used for therapy. Additionally, I-124 (although not routinely clinically used) and 18F-FDG may be helpful in certain situations, but they require access to PET.

    ARRS Quick Bytes

    ARRS Quick Bytes is a member-exclusive benefit that provides 20-minute videos on emerging topics in radiology for CME on the go.

    There are several controversies regarding imaging and therapy of patients with thyroid cancer. For example, there is significant debate about the need for imaging before and after therapy using radioactive iodine vs other modalities, such as ultrasound and CT. Also, whereas RAI therapy has been a mainstay in thyroid cancer treatment for years, there have been recent changes in how this therapy is done. Historically, the amount of RAI to give for the purposes of therapy was based on disease extent, so those patients with distant metastases received a higher empiric amount of RAI than those with localized disease. Furthermore, pediatric patients were treated similarly to adults. Recently, however, we have tried to lower the amount of RAI administered based on the patient’s risk stratification and age to improve long term outcome and minimize radiation exposure, where possible. There is also a recognition that pediatric patients have some different clinical issues; thus, their approach to RAI has some key differences compared to adults.

    While the use of and approach to theranostics in thyroid cancer is evolving, a few constants remain. Specifi cally, the experience and expertise of the multidisciplinary care team, as well as the desires of the patient, all need to be considered when making decisions about how to proceed. Imagers must recognize which information they can glean from their scans will best assist in determining the optimal course for treatment. When deciding on therapy, the amount and type of therapy to be given is based not only on pathology, but also on the medical team and patient’s wishes for short- and long-term follow up. Ultimately, as physicians who are intimately involved with both imaging and therapy, our insight can offer a lot to the overall care of the patient with thyroid cancer.

  • Dial M for Merger: Teleradiology’s Second Act

    Dial M for Merger: Teleradiology’s Second Act

    avatar

    Logan K. Young

    Staff Writer

    Published March 23, 2020

    With technological innovation teeming and networks more globalized than ever before, teleradiology—an imaging practice heavily reliant upon both—would seem uniquely moored to rise with these two tides. As advancement often begets acquisition, and especially as radiology practices continue to amalgamate, some teleradiology experts are floating a seemingly counterintuitive notion: the teleradiology wave could be starting to crest.

    To be sure, long-distance diagnosis has been dialed into imaging for some 30 years.

    In late 1991, University of Kansas researcher Arch W. Templeton boasted in AJR that more than 1,000 cases had been “digitized, transmitted, and printed on our teleradiology system.” Four years later for the journal, Douglas R. DeCorato detailed his after-dark developments, writing “all radiologic studies performed at Roosevelt Hospital between the hours of midnight and 8 A.M. were digitized and then transmitted over a T1 fiberoptic link to the radiology department of St. Luke’s Hospital, 4.8 kilometers away.”

    Transmissions from individual institutions coming in loud and clear, by the summer of 2005, David B. Larson and colleagues had painted the first “comprehensive portrait of teleradiology in radiology practices.” Based upon a 66% response rate from the 970 practices that the American College of Radiology (ACR) surveyed in 1999, as Larson confirmed in AJR, “Seventy-one percent of multiradiologist practices had teleradiology systems in place, using them to interpret 5% of their studies. For solo practices, corresponding statistics were 30% and 14%.”

    Flash forward a scant two years, when Todd L. Ebbert sought to capture and communicate just how big teleradiology had become. His 2007 AJR web exclusive had two distinct objectives: “to describe in detail the use of teleradiology in 2003 and to report on changes since 1999 in this rapidly evolving field.” Armed with the ACR’s Survey of Radiologists from 2003 (sent by mail, ironically), as well as its 1999 Survey of Practices, Ebbert et al. verified that 67% of radiology practices in the United States, “which included 78% of all U.S. radiologists,” had performed teleradiology.

    Almost a decade’s worth of telemedicine would be performed until the first nationally representative approximation of telehealth practices across all medical specialties was published.

    According to the 2016 American Medical Association’s Physician Practice Benchmark Survey, “15.4% of physicians worked in practices that used telemedicine for a wide spectrum of patient interactions.” Said interactions included e-visits, “as well as diagnoses made by radiologists who used telemedicine to store and forward data.”

    Now, nearly three decades removed from AJR’s initial frontline reporting, is the teleradiology revolution running out of steam? Well, the business answer at least is rather hazy.

    Citing a trend analysis from Research and Markets, in 2018, Diagnostic Imaging reported that the global teleradiology marketplace was forecasted to reach $8.2 billion by 2024. Despite that healthy compound annual growth rate, president and chief executive officer of Imaging Consultants, Inc., Lawrence Muroff, cautioned that teleradiology’s market share was likely to shrink over the next three to five years.

    Echoing Muroff’s sentiments, Elizabeth Krupinski, professor and vice chair for research in the department of radiology and imaging sciences at Emory University School of Medicine, indicated a swing allied with artificial intelligence, saying “I can see teleradiology changing as a byproduct of the overall industry shift.”

    And already, less than a year later, as Muroff told Diagnostic Imaging this past September: “Teleradiology is a saturated, mature market that is no longer growing.” “If anything,” he compounded, “it’s shrinking somewhat because, as practices get larger, they have a greater capability of providing comprehensive call themselves.”

    Corporate takeovers of independent radiology practices—what AuntMinnie flagged as one of 2019’s “biggest threats to radiology”—has taken on teleradiology, too. As reporters Brian Casey and Erik Ridley explained: “The rise of corporate radiology companies— which have oftentimes grown by acquiring smaller groups— is turning many radiologists from entrepreneurs into employees. Meanwhile, hospitals continue to expand by swallowing up outpatient centers that once operated independently.”

    The bigger they are, the louder their call, indeed.

    In his inquiry into the October white paper from the ACR’s Corporatization Task Force, Jake Fishman of The Imaging Wire concluded that continuing consolidation within the industry should be expected through 2030, “depending on capital liquidity, legislative/regulatory changes, and market volatility.”

    A newer survey from KPMG tapped 330 corporate, private equity, and investment banking executives in the life science industries for their two cents. And what did this “Big Four” accounting organization find? This year, the health care sector will endure even more absorption than it did in 2019.

    Of course, suffering the slings and arrows of more and more mergers and acquisitions (M&A) doesn’t have to necessarily stymie teleradiology’s forward march.

    In this past November’s issue of AJR, Michael A. Bruno and team pointed out that “in a fully integrated practice model a single group of subspecialist radiologists would provide care seamlessly at all practice sites, either on a rotational basis or by sharing cases through teleradiology or shared PACS systems, across the full spectrum of care.”

    Ultimately, the truest test of tele-harmony writ large depends on who, how, and expressly where you ask.

    The law firm Foley & Lardner’s third end-of-year, state-by-state canvass of telehealth coverage recounted a “sea change” in legislation requiring commercial payers to reimburse providers for virtually rendered services. Yet, two months prior, the assessment from analytics juggernaut J.D. Power noted coast-to-coast consumer adoption of telehealth services as “stubbornly low.”

    Alas, crunching the latest numbers on the international ledger fuzzies things further.

    Worldwide venture funding for digital health, including private equity and corporate venture capital, declined 6% over the last fiscal year. Nevertheless, a Global Market Insights report from March 2019 had predicted that telemedicine’s global share would more than triple by 2025—ballooning from its current $38.3 billion valuation to $130.5 billion.

    In light of all the headline legislation, relentless coups, and exaggerated projections implying the demise of enterprise teleradiology, according to its most thorough clinical evaluation to date, the actual practice of teleradiology is very much alive and well.

    In the December 2019 issue of Journal of the American College of Radiology, incoming AJR editor in chief Andrew B. Rosenkrantz got granular regarding radiologists’ overall “habits, attitudes, and perceptions on teleradiology practice.”

    Defining teleradiology as “the interpretation of medical imaging examinations at a separate facility from where said examination was performed,” Rosenkrantz and his colleagues solicited responses (appropriately enough, via email) from a random sample of 936 ACR members. While a clear majority, 731 respondents, designated their main work setting as non-teleradiology, 85.6% of that cohort indicated they had practiced teleradiology within the past 10 years. Furthermore, 25.4% stated teleradiology comprised a majority of their annual imaging volumes.

    No longer the realm of nighthawks, a staggering 91.3% of respondents said that they had implemented teleradiology during normal business hours, while 44.5% to 79.6% said they had implemented teleradiology over evening, overnight, and weekend shifts.

    In rural areas, 46.2% of American radiologists surveyed by Rosenkrantz reported performing teleradiology, and 37.2% reported performing teleradiology in critical access hospitals.

    Helping working radiologists realize after-hours success and expand coverage for underserved patients, “despite historic concerns,” Rosenkrantz reassured, “teleradiology is widespread throughout modern radiology practice.”

    Like most cutting-edge revolutions, efficacious telemedicine continues to spread.

    From the TeleWOW program in northern Maine connecting more than 50 obese children and young adults with certified health and wellness specialists to the Michigan Department of Health and Human Services’ four-year, $1.6 million federal grant to expand a statewide telehealth platform for epilepsy care management, right now, individual states are the freer laboratories for this digital democracy.

    At the same time, Amazon is paying for workers diagnosed with cancer to physically see specialists down in Los Angeles’ Silicon Beach, while piloting its own virtual health service for employees and their dependents, Amazon Care, led by pulmonary specialist, public health wonk, and defector from Apple, Vin Gupta.

    There’s good news from abroad, too.

    A pilot study just published ahead-of-print in AJR by a team from Germany’s second-largest city and Europe’s third-largest port, Hamburg, christened the concept of maritime telemedicine with the inauguration of a PACS-centered service staffed 24/7 by specialized radiologists at a tertiary hospital on shore.

    So, what do the trade machinations of tomorrow or the next administration’s regulations portend for teleradiology’s next wave, the clinical and the commercial?

    Perhaps a startup like Nines in Palo Alto, California might know those breakers best.

    Fresh out of stealth mode and buttressed by $16.5 million in Series A cash, the mission of this teleradiology company is decidedly asynchronous—assist radiologists in triaging head CT scans through machine learning.

    In other words, M&A, meet AI.

  • Vaping-Associated Lung Injuries

    Vaping-Associated Lung Injuries

    avatar

    Travis S. Henry

    Associate Professor of Clinical Radiology
    University of California, San Francisco

    Published January 10, 2020

    The latter half of 2019 saw the identification of an entirely new respiratory illness and introduction of a new diagnosis— e-cigarette, or vaping, product use associated lung injury (EVALI)—into the medical lexicon. Based on current understanding, EVALI is an acute or subacute respiratory illness that is often severe and in some cases fatal, purported to be a chemical pneumonitis resulting from inhalation of one or more toxic substances. As of November 5, the Centers for Disease Control (CDC) reports 2,051 cases of EVALI in the United States, including every state except Alaska, plus the District of Columbia, with 39 deaths in 24 states. The reported cases have affected patients as young as 13 and as old as 75, with males about twice as common as females. Nearly all of these patients have presented with acute or subacute respiratory symptoms, and not surprisingly, thoracic imaging (chest radiograph and CT) has become central to the diagnosis of these patients. Knowledge about these diseases is changing every day, and it is imperative that diagnostic radiologists have a general understanding of what vaping is, how it looks on imaging, and what we know so far.

    What Is an E-cigarette, and What Is Vaping?

    An e-cigarette is an electronic device that is designed to simulate traditional smoking. Instead of the combustion of tobacco (or, more recently, marijuana), e-cigarettes heat a substance (usually liquid, oil, or wax) to create a vapor that is inhaled, hence the term “vaping.” E-cigarettes were invented in 2003 and introduced in the U.S. around 2007.

    Most devices have three main components: a chamber or cartridge that contains the substance to be heated and vaporized (also referred to as the e-liquid); an atomizer or heating element that vaporizes the substance in the cartridge, so that it can be inhaled; and a battery to power the heating source.

    Like any piece of technology, these devices have evolved and are becoming increasingly sophisticated. Early devices tended to mimic tobacco cigarettes in shape, but now admittedly look outdated, compared to the most recent generations of products that are smaller, sleeker, and more easily concealed. Some bear more of a resemblance to USB thumb drives than smoking devices, and a few even have Bluetooth connectivity to track how much one vapes.

    What Substances Do People Vape?

    The substances that patients vape are almost limitless, and this variability is one of the main reasons it has been so difficult to pinpoint the recent surge of cases on one specific cause. A majority of recent cases have been associated with vaping tetrahydrocannabinol (THC) or other marijuana derivatives, and there is mounting evidence for vitamin E acetate as one of the main culprits. While a majority of patients with EVALI report vaping both THC and nicotine, some patients report vaping exclusively nicotine, so it is possibly not just the vitamin E acetate, a thickening agent in THC-containing vaping products, that is to blame.

    At this time, there is little regulation of the vaping industry, although the FDA announced in September that it plans to begin regulating some of the nicotine-based substances, particularly flavored products that are perceived to be more attractive to adolescents and young adults. Some cities, such as San Francisco, have begun instituting bans on sales of e-cigarettes.

    Given the lack of regulation, there are many ways that the substances are stored, filled, and refilled, as well as many suppliers from where patients get their vaping substances. Some are refillable cartridges, whereas others are disposable pods; some people create their own “home brews” or buy products off the street that may not be sterile and may be adulterated. It is suspected that some of the aftermarket or “off-the-street” products may be more likely to cause injury, and the CDC advises against their use.

    Nicotine is often mixed with flavoring agents or “vape juice,” and there are more than 15,000 different flavors. Adults may prefer more traditional flavors such as tobacco, mint, or menthol that try to mimic the taste of cigarette smoking. But other flavors more unabashedly appeal to teenagers and adolescents—many of whom were never smokers prior to vaping. A study in Pediatrics found that adolescents who vaped these nontraditional flavors (including fruit, candy, sweet or dessert, buttery, or other blends not including traditional flavors) were more likely to continue vaping at six months and take more puffs per occasion. The use of these flavors resulted in greater self-reported addiction and satisfaction in another study of young adults.

    Why the Recent Rise in Vaping Cases?

    Vaping is becoming more popular, particularly among adolescents and young adults; the variety of substances that can be consumed has expanded; and e-cigarette companies have increased the marketing of their products, just to name a few. But with the constant media coverage, everyone thinks about vaping as a cause of lung injury, and that has led to increased recognition by physicians, including radiologists.

    The first case we suspected to be lung disease due to vaping was in 2014 in an adult male patient with ground-glass opacity (GGO) on CT, although this case could never be proven, as there wasn’t even a name for this disease then. The first confirmed case we saw was in 2017 in a female who was vaping THC to help her sleep. Case reports of EVALI date back to 2012, but our original article in AJR, “Imaging Findings of Vaping-Associated Lung Injury,” is the first to review and present all of the different imaging patterns that we have encountered so far. The varied appearances underscore the confusion and difficulty in these cases, arguing in support of a multifactorial cause.

    What’s the Bare Minimum Radiologists Should Know About Vaping and EVALI?

    At the time of submission of our manuscript to AJR, there was no accepted case definition for what constituted vaping-associated lung injury. However, based in part on the work since published by Leyden et al. in the New England Journal of Medicine on the cases reported to the Illinois and Wisconsin state health departments, the CDC has proposed definitions of confirmed and probable cases. It must be emphasized that EVALI is still a diagnosis of exclusion, as there is no laboratory test to confirm the diagnosis.

    A confirmed case of EVALI is defined as:

    • using an e-cigarette or dabbing (i.e., heating concentrated cannabis oil or wax and inhaling the vapors) in 90 days prior to symptom onset
    • abnormalities on either chest radiograph or CT
    • negative infectious workup
    • no alternative plausible diagnosis (e.g., cardiac, rheumatalogic, or neoplastic)

    A probable case of EVALI is similar—the one distinction that either an infection was detected by culture or polymerase chain reaction but not suspected of being the sole cause of lung injury, or minimum testing to exclude infection was not performed.

    Imaging is part of the case definition, and as such, radiologists are critical to the diagnosis. The CDC definition verbatim is “pulmonary infiltrate, such as opacities, on plain film chest radiograph or ground-glass opacities on chest CT,” but to any radiologist, this sounds like a vague and generic explanation. One can review the many different patterns of lung injury in our AJR paper, but the one commonality from the cases we present, our review of the literature, and those cases we’ve encountered since is that these patients almost universally present with bilateral opacities that look like acute lung injury and/or organizing pneumonia. Cases may be diffuse, upper- or lower-lobe predominant.

    In the appropriate clinical setting, it is arguable that chest radiograph should be sufficient for the diagnosis if bilateral opacities are present, although clinicians often order CT to evaluate for alternative causes, such as pulmonary embolism. Patients who present with acute illness may require ventilatory support. Unfortunately, some patients have died. Treatment with corticosteroids seems to be effective. While most patients completely heal, there is little data on the long-term appearance of survivors of EVALI.

    Lung Pathology of EVALI

    For most cases of EVALI, obtaining lung tissue is unnecessary for establishing the diagnosis, although some literature on pathology now exists. The largest series of cases where pathologic specimens were available was recently published and concluded that EVALI is “a form of airway-centered chemical pneumonitis from one or more toxic substances” in the aerosolized vapor. The presence of lipid-laden macrophages and positive oil-red-O stains has raised the possibility of exogenous lipoid pneumonia due to vitamin E acetate. Regardless of the underlying pathology, macroscopic fat has not been observed on CT imaging.

    What Does the Future Hold for Vaping and EVALI?

    The recent illnesses and deaths represent a grave tragedy and public health crisis with little precedent. However, it is important for physicians to not focus exclusively on the negative press. Lost in the daily media shuffle is the fact that for some patients, e-cigarettes may be an effective tool for smoking cessation. Recent data from a randomized control trial in the United Kingdom found that nicotine-containing e-cigarettes were almost twice as effective for smoking cessation at one year compared to other forms of nicotine replacement, but the abstinence rate was still only 18.0% (vs 9.9%). Patients in the e-cigarette group also experienced a greater reduction in cough and phlegm production. On the other hand, can patients stop vaping once they have started? At the one-year mark, 80% of the patients using e-cigarettes in this group were still using. Many health officials are worried that it is just replacing one habit (smoking) with a slightly less bad habit (vaping). Vaping might be safer than traditional cigarette use, but at this point, we just don’t know.

    Hopefully, the agents responsible for cases of EVALI will be discovered, and cases of acute lung injury will subside, but what are the long-term effects of vaping? Vaping is a new practice that has been around for barely more than a decade, and it is certainly a worry that long-term vaping could lead to more chronic lung disease and fibrosis. We have seen some indication that vaping may progress to fibrosis, although this realm is largely unexplored and ripe for imaging research.


    The opinions expressed in InPractice magazine are those of the author(s); they do not necessarily reflect the viewpoint or position of the editors, reviewers, or publisher.

  • Imaging Advances Toward Autism Diagnosis

    Imaging Advances Toward Autism Diagnosis

    Logan Young
    Staff Writer

    Published March 21, 2020

    To be sure, radiology has come a long, long way. Only 10 years ago, the best medical imaging could do for children with autism spectrum disorder (ASD) was to identify key abnormalities in the brains of those already diagnosed—i.e., 1 in 59 children, according to today’s estimates from the Centers for Disease Control and Prevention’s (CDC) Autism and Developmental Disabilities Monitoring Network. A half-decade earlier, cortical gray-matter studies were discovering overall substantially thicker cortex for boys with autism, alongside similar findings in the temporal and parietal lobes, whereas diffusion tensor imaging was being used to illustrate disruption of white-matter tracts between regions implicated in impaired social cognition. Meanwhile, just as early functional MRI (fMRI) studies on ASD were exploring core symptom domains via activation patterns in response to mimesis, facial processing, theory of mind, semantic sentence comprehension, lexical semantic processing, and tasks involving variable imagery content, researchers were also looking to magnetic resonance spectroscopy (MRS) to assess models regarding excitation and inhibition ratios in ASD.

    Writing on MRS in the October 2004 issue of the Journal of NeuroscienceMatthew K. Belmonte from the Autism Research Centre at the University of Cambridge duly noted: “It has been said that people with autism suffer from a lack of ‘central coherence,’ the cognitive ability to bind together a jumble of separate features into a single, coherent object or concept. Ironically, the same can be said of the field of autism research, which all too often seems a fragmented tapestry stitched from differing analytical threads and theoretical patterns”.

    Fifteen years removed, while ASD remains very much an heterogeneous disorder of multifactorial etiology, evidencing an expansive range of symptoms and severities alike, radiology is in the process of reconciling so many image threads. True, bereft of a priori behavioral phenotyping (e.g., Autism Diagnostic Observation Schedule [ADOS], Social Responsiveness Scale, Kaufman Brief Intelligence Test, composite IQ score), right now, radiology alone still cannot definitively diagnose ASD in anyone, child or adult. There is good news, though. The radiology research paradigm is shifting—away from mere aberration identification to clinical diagnosis.

    The sands underneath it all first loosened in 2014, when University of Pittsburgh and Carnegie Mellon researchers utilized machine-learning algorithms to grade 34 young adults as either autistic or control with > 97% accuracy based upon fMRI neurocognitive markers for eight social interaction verbs: compliment, insult, adore, hate, hug, kick, encourage, and humiliate. Moving quickly, one year later, Virginia Tech Carilion Research Institute professor P. Read Montague synthesized nine years’ worth of previous trials to announce in Clinical Psychological Science that his team had developed an even more efficient technique to diagnose children with ASD in under two minutes: single-stimulus fMRI. Subjects were shown 15 images of themselves and 15 images of another child, matched according to age and gender, for four seconds per image in randomized order. Like the control adults in Montague’s earlier experiments with imaging for ASD, when viewing their own pictures, the control children had a high response in the middle cingulate cortex; by contrast, children with ASD showed an appreciably diminished reaction. Notably, Montague et al. could detect this disparity using one, solitary image.

    This May, much of Montague’s same colleagues, including principal investigator, Kenneth Kishida of the Wake Forest School of Medicine, made headlines for a Biological Psychology article demonstrating that a single stimulus and < 30 seconds of fMRI data were sufficient to differentiate ASD children from their typically developing (TD) peers. To test a hypothesis that responsiveness of the brain’s ventral medial prefrontal cortex (vmPFC) in children diagnosed with ASD is diminished for visual cues, denoting high-value social interaction, 40 participants (of which 12 had ASD and 28 were TD), aged 6–18 years old, were prompted to observe images of four faces and four objects, which were projected onto a screen and viewed through a mirror during fMRI scanning. With each image characterized as favorite, pleasant, neutral, or unpleasant, the favorite images depicted each of the participants’ self-selected favored face and object, and the remaining images were selected from the International Affective Picture System (IAPS) database. Each of the eight images was then displayed only once for five seconds during a block that repeated six times. Following the completion of 12- to 15-minute MRI scans, participants were shown the identical set of images on a computer screen, ranking them in order, from pleasant to unpleasant, with a self-assessing sliding scale. Results showed that the average response of vmPFC was significantly lower in the ASD cohort, compared to the TD cohort.

    “How the brain responded to these pictures is consistent with our hypothesis that the brains of children with autism do not encode the value of social exchange in the same way as typically developing children,” Kishida said in a prepared statement. “Based on our study,” he continued, “we envision a test for autism in which a child could simply get into a scanner, be shown a set of pictures, and within 30 seconds, have an objective measurement that indicates if their brain responds to social stimulus and non-social stimuli.”

    There are limitations here. Because these 40 children were permitted to specify favored objects and people, reasonably assuming that there were distinct visual differences between these non-IAPS images and that canonical cache, Kishida conceded the possibility that at least some of the reported response differential could simply be due to known vs. novel. Moreover, since ASD disproportionately affects male patients—i.e., four times more common among boys than girls, the CDC maintains—he acknowledged an optimal design could be updated to investigate the gender divide between the ASD and the TD children more thoroughly.

    “Based on our study, we envision a test for autism in which a child could simply get into a scanner, be shown a set of pictures, and within 30 seconds, have an objective measurement that indicates if their brain responds to social stimulus and non-social stimuli.”

    —Kenneth Kishida

    Another Wake Forest faculty member, Christopher T. Whitlow, has been presenting related research on ASD imaging since 2014. As his studies have surveyed patterns of joint variability in severely preterm infants, might we see an eventual diagnostic environment where Whitlow’s voxel-based morphometry informs Kishida and Montague’s single-stimulus exemplar to evidence brain dysfunction in patients younger than the age-six threshold?

    Although reproductive stoppage (i.e., the tendency for arrested propagation after diagnosis of an affected child) can lead to underestimates of sibling recurrence risk for ASD, with ascertainment biases and overreporting often pointing to its inflation, we should focus on the family first. In 2011, the multisite international network, Baby Siblings Research Consortium, conducted a prospective longitudinal study of 664 infants who had an older biological sibling with ASD, monitoring them from early life to 36 months, when they were classified as having or not having ASD—an ASD taxonomy requiring exceeding the ADOS cut-off, as well as an expert’s diagnosis. In total, 18.7% of infants developed ASD. Whereas infant age at enrollment, gender and functioning level of the infant’s older sibling, and other demographic circumstances did not predict ASD outcome, infant gender and the presence of > 1 older affected sibling were significant forecasters. Again, there was a nearly threefold risk escalation for male subjects and an additional twofold increase in risk if there was > 1 older affected sibling.

    Family history, meet deep learning. Recent findings published in Science Translational Medicine by University of North Carolina at Chapel Hill researchers revealed that when applied to functional connectivity MRI (fcMRI) data at six months of age in infants with high familial risk for ASD, a nested, cross-validated machine-learning algorithm predicted an ASD diagnosis with > 96% accuracy at 24 months. Citing several brain variances—both morphological and electro-physiological—members of his team had documented as early as six months in infants later diagnosed with ASD, “Given the complexity and heterogeneity of ASD,” lead author Robert W. Emerson surmised, “methods for the early detection of ASD using brain metrics will likely require information that is multivariate, complex, and developmentally sensitive.” Apropos, Emerson et al. employed an array of 230 regions of interest (ROI) previously defined across the entire brain to create functional connectivity matrices from the fMRI scans of 59 at-risk infants (11 diagnosed with ASD at 24 months, 48 who did not have ASD at 24 months) during natural sleep without sedation at their six-month visit. “Our logic was that these regions would be the most likely to contribute to the discrimination between groups in the 59 separate support vector machine models,” wrote Emerson. With data collection resulting in 26,335 usable ROI pairs exemplifying each infant’s whole-brain functional constitution by training MATLAB’s Statistics and Machine Learning Toolbox (Mathworks, Inc.) to ascertain the causal patterns of individual separation, the probability that infants with a positive classification truly had ASD (positive predictive value) at 24 months was 100% (95% CI, 62.9–100). Negative predictive value at 24 months was 96% (95% CI, 85.1–99.3).

    A first-of-its-kind study from November 2018 that leveraged the imaging archive of Geisinger Health System in Danville, Pennsylvania, takes us back to the future, examining early brain markers in ASD to further the promise of artificial intelligence for earlier detection. Renewing his dissertation research, Gajendra J. Katuwal and colleagues applied random forest ensemble learning to models trained on 687 brain features of Freesurfer v 5.3.0 (Martinos Center for Biomedical Imaging) to compare cortical and sub-cortical morphometric features for ASD vs. non-ASD classification. Their query of head MR images from Geisinger’s institutional tranche, after removing those with artifacts, motion, lesions, abnormally large ventricles, and neurodevelopmental disorders as identified by International Classification of Diseases code, yielded 112 non-ASD and 115 ASD subjects. Eschewing gender confounds, 20 non-ASD and 34 ASD scans of female subjects were excluded. Although total intracranial volume (TIV) of ASD measured 5.5% larger than the control, brain volumes of other ROI, when calculated as TIV percentage, measured smaller in ASD—partially due to larger (> 10%) ventricles in ASD. ASD’s larger TIV exhibited correlates with greater surface area and aggregate cortical folding, yet not with cortical thickness. ASD frontal and temporal white-matter tracts evidenced less image intensity, seemingly suggesting myelination deficit. Ultimately, Katuwal’s methodology was able to achieve 95% AUC for ASD vs. non-ASD classification using all brain features. When stochastic discrimination was discrete for each feature type, image intensity yielded the highest predictive power (95% AUC), followed by cortical folding index (69%), cortical and subcortical volume (69%), and surface area (68%).

    According to Katuwal, “the most important classification feature was white matter intensity surrounding the rostral middle frontal gyrus,” which measured lower (d = 0.77, p = 0.04) in ASD.

    Because medical technology also rises, medical imaging, itself, is sure to manifest a more prominent role over time among allied sciences with regards to forthcoming ASD diagnoses and concomitant, personalized care. To that end, in order to fully apprehend the neuroanatomical foundations of ASD, a comprehensive, multimodal surveillance of early brain alterations would seem to light the best forward path. Progress isn’t always a straight line, of course, so radiology has places yet to go, indeed.


    The opinions expressed in InPractice magazine are those of the author(s); they do not necessarily reflect the viewpoint or position of the editors, reviewers, or publisher.

  • White Horse, Yellow Journal: Berquist Bids Adieu to AJR

    White Horse, Yellow Journal: Berquist Bids Adieu to AJR

    avatar

    Logan K. Young
    Staff Writer

    Published March 21, 2020

    When Thomas H. Berquist logs off his iPad this summer, his 12-year tenure as the 12th editor in chief of the American Journal of Roentgenology (AJR) will capstone a period of unprecedented growth for the 113-year-old publication. Truly the end of an era, only two other men will have occupied the AJR’s chief chair longer than Berquist: Lawrence Reynolds, who picked up the mantle in 1930 and died in office 31 years later, and his immediate successor, Traian Leucutia, whose editorship (1961–75) lasted just two years longer than this lauded, yet humble Mayo Clinic radiologist.

    Articulating an expansive vision for radiology’s beloved “yellow journal” from his first days at the desk in late 2008, the ARRS Publications Committee, to whom Berquist has reported for some 150 issues of AJR, agrees that he’s fostered a unique editorial climate ever since—one of both exacting rigor and earnest diversity.

    “Dr. Berquist is one of the most inclusive leaders that I have ever had the pleasure to work with,” says Deborah Baumgarten, ARRS Publications Committee chair. “He solicits opinions and really listens to and considers what others have said. You feel like you matter to him.”

    Acknowledging achievement only if it’s data-borne, the internationally recognized author of 38 books on medical imaging tells InPractice he remains very much “a numbers guy.”

    Incidentally, despite ARRS’ announcement of Berquist’s retirement more than 15 months ago, submissions to the journal continue to pour in unabated. And although AJR’s acceptance rate “still hovers right around 20%,” Berquist does admit that the overall quality of the articles being submitted is likely as good as it has ever been.

    For once, there’s a causation implied by the correlation.

    Two years ago, Berquist himself took to these same pages to reassert AJR’s raison d’être in two words: “evidence-based articles”. Codifying the journal’s reporting guidelines for Original Research and Review articles “to assist authors in providing optimal consistent content,” he also detailed significant revisions to the Standards for Reporting Diagnostic Accuracy Studies (STARD) and Standards for Reporting Observation Studies in Epidemiology (STROBE) checklists, “in an effort to provide more imaging-friendly guidelines.”

    With humility and precision, Berquist now notes, “to date, there have been 128 STARD submissions and 33 STROBE submissions to AJR,” casually mentioning the “significant recruitment initiative” he’s spearheading to further improve these types of content enhancement, which he’s keen to note will soldier on even without him aboard.

    Circulation is up, too. With AJR enjoying record readership worldwide—especially unique views and clicks, online and mobile, at AJRonline.org—as the outgoing editor in chief wrote in his “Things We Learned Along the Way” editorial from November, “the online version is the journal of record.”

    It was Berquist’s predecessor, Robert Stanley, who introduced the notion of electronic article submission. Not surprisingly, his institution of web-based submissions yielded a marked increase in international authors submitting to AJR, sending Stanley and staff scrambling to enlist foreign-language reviewers. Sixteen years post-Stanley, Berquist recalls yet another telling audit.

    “Currently, there are 2,321 total AJR reviewers,” he says. “Eighty percent hail from the United States, and 20% are based internationally.”

    Asked how a more international distribution due to ever-increasing scholar globalization might alter the scope of AJR content to come, thus far, Berquist says he’s seen only one year, 2014, where foreign submissions outpaced submissions from the U.S. As always, Berquist’s bias tends toward scientific scrutiny, not identity politics, “particularly where a benign cultural difference could escalate to the level of significant medicolegal dilemma.”

    Ultimately, he’d much rather talk residents and reviewers than matters foreign and domestic. Regarding residents, Berquist is quick to credit Howard P. Forman for initiating the journal’s Trainee Reviewer program, pointing out the present group of “61 trainee reviewers and additional new reviewers who have mentors as they begin their reviewer role.”

    Naturally, Berquist has streamlined the onboarding process; it began two years ago at the Marriott Wardman Park Hotel in Washington, D.C.

    In 2018, alongside Cheryl S. Merrill, ARRS’ director of publications, Berquist debuted what would eventually become an essential component of the ARRS Annual Meeting that speaks volumes about the significance of scientific integrity—a two hour course the duo affectionately dubbed “Rock the Review: How to Get a Perfect Score.” A perfect score equals 4.0, sure, but what does said “rocking it” actually look like on the page?

    For that inquiry, Berquist settles in: “The review must include sophisticated, detailed comments to authors with line and page referencing to enhance the content and relevance of the work; concise, confidential comments to the editor; and the reviews must be completed in the allotted 14 days or earlier.”

    As for his active reviewers, again, Berquist knows their numbers by heart.

    “Ten percent of AJR reviewers have scores less than 3.0, and 40% have scores between 3.0–3.5,” he says. “Half of the reviewers for AJR, nearly 1,200, have a perfect 4.0,” Berquist half-beams, adding that each and every reviewer is evaluated at least yearly, “more frequently should their approach warrant it.” He reveals “any reviewer may request a review of themselves at any time,” too

    Resigned to the inherent difficulty of “consistent communication” with more than 2,300 reviewers across the globe, Berquist’s not bereft of procedure here either.

    “There are multiple data points available each day,” he says of his quality control, “including how many invitations a reviewer has received, accepted, and declined; how many times a reviewer has been uninvited for not responding; the last review accepted and completed and the last review declined; reviews in progress; and the mean reviewer score.”

    Lest you think he’s all scores and no play, there are prizes— albeit hard-won ones.

    Known for penning personal letters to stellar reviewers, Berquist also established “a Distinguished Reviewers category for individuals performing 10 or more reviews in a given year with score of 3.0 or higher.” Reviewers’ names are featured on the AJR masthead for the entirety of the following year, and their departmental chairs are notified of the distinction.

    For “above and beyond assistance,” states Berquist, “we initiated the Gold and Silver Distinguished Reviewer Achievement Awards in 2018 for reviewers with 100 or more reviews and 50–99 reviews, respectively.” These reviews must be scored at least 3.5, and Berquist remarks that 91 AJR reviewers have received 14 gold and 77 silver trophies during the Reviewer’s Luncheon at the ARRS Annual Meeting.

    “We now have Platinum and Diamond Distinguished Reviewer Achievement Awards for scores 3.5 or higher for 150– 199 reviews and 200 or more reviews, respectively,” he says with that muted smile returning.

    Acknowledging that the whole notion of peer review itself is in flux, Berquist’s not averse to the creep of new ideas. His interest in zeitgeist systems thinking, like Just Culture, has been abiding, and he confesses to “a certain anticipation” for an updated model of shared accountability.

    Never not teaching, the diagnostic radiologist is wont for a metaphor.

    “Peer review is a lot like the Supreme Court,” Berquist claims. “It’s by no means perfect, but it’s the best we have now.”

    For all reviewers, authors, and journal staff, time is always of the essence. Recalling an AJR authors’ survey “where 85% of respondents considered speed to publication extremely important,” once more, the numbers stay on Berquist’s side.

    “In 2013, the time to first decision was 37.6 days,” he says. Streamlined protocols in 2017, implemented by the journal’s inhouse staff, shrunk that time down to 25 days. For 2019, Berquist tallies “the average time to first decision is 18.8 days,” compared to 20 days at the same time the previous year.

    Prior to recent concerted efforts, he laments that the elapsed time from first decision to AJR publication measured a “protracted 147 days.” Understandably, Berquist happily reports that number has been cut almost in half.

    Asked who or what is most responsible for this optimized circle to publication, AJR’s chief editorial officer neither hesitates nor equivocates: “The journal staff deserve the credit—all of it.”

    Berquist balks at the term officer. His self-effacing streak matched only by his work ethic, this self-described “policeman with no gun” has doggedly pursued often competing commitments at AJR—everything from article enhancements, reviewer recognition, and production improvements to that ever-important journal impact factor.

    And at least until June, armed or not, the buck still stops with Berquist.

    “Right now, the impact score of AJR is 3.161,” he rattles off to the third decimal. “That’s the highest the score has ever been. But it’s not yet a 4, so in that regard,” he doesn’t pause, “I’ve failed.”

    Impact factor is a scientometric index, yes, but Berquist concedes there are more popular proxies, especially in pixels. It was under his administration that ARRS joined Twitter, posted a DOI on Instagram, and published an AJR video to YouTube. It was during Berquist’s watch that democratized platforms such as these breathed new, sometimes second lives to articles about magnetic eyelashes as MRI artifacts and his personal favorite, radiologic detection of inadvertently ingested wire bristles from a grill-cleaning brush.

    “It’s exciting, it’s all visibility, and we’re getting much better at it,” Berquist says of social media exposure. “We’re also exploring more and more things adjacent to it,” his subtle reference to AJR Podcasts, available cross-platform via iTunes and Google Play.

    At the end of the day, it’s not impact factor or Just Culture or homepage views that’s kept Berquist up at night these last 12 years.

    “For me, the key thing has always been scientific integrity,” he says. “In fact, it’s really only this. But in reality, there are times when I feel alone on this white horse, swinging at windmills.”

    Of course, the man of La Mancha never had to traverse this modern landscape of so many open-access journals—an “exponential proliferation” our Jacksonville, Florida physician cites as his chief concern for medical publishing moving forward.

    “There were about 80 radiology journals when I began at AJR,” Berquist remembers. Today, he inventories more than 800 open-access journals publishing medical imaging content on a regular basis. How could Berquist alone possibly guard against every duplicative breach?

    “I’m not sure we can anymore,” Berquist answers, invoking both pronouns.

    According to the editor in chief, AJR uses a huge database, Similarity Check (CrossRef), for manuscript evaluation, as well as “a 10% or greater duplication and singles source greater than or equal to 3% to help assess duplication more thoroughly.” Given that a typical year will end in more than 1,800 submissions to the cue, the journal’s two-factor safeguard invariably yields “a staggering number” of replicate queries.

    Noting that medical schools, residency programs, and fellowships lack a proper course in publishing ethics—Berquist’s biggest regret is not advocating harder for a nationwide curriculum—“only 1.8% of the submissions AJR receives contain less than 10% duplication,” he sighs. “We can’t keep kicking this can down the road.”

    With nuclear medicine becoming de rigueur in the 1960s, ARRS members of a certain vintage will recall how Traian Leucutia relented to rechristening AJR the American Journal of Roentgenology, Radium Therapy, and Nuclear Medicine. The late Melvin M. Figley not only changed it back in 1976, he kept the word “Roentgenology” in the title, maintaining its myriad historical associations. As radiology enters the third decade of the new millennium, does Berquist see an emerging modality or pressing topic that could necessitate another retitling of the journal?

    “Believe it or not, changing the name of AJR has come up,” he says. “Imaging, as a whole, is a lot of different things, and imaging is always evolving, so if the ABR’s requirements change accordingly, I could foresee the ARRS Executive Council maybe taking a vote.”

    Berquist has but one simple request for the next editor: “Whatever happens, I just hope we’ll keep on calling AJR the yellow journal.” Having championed the leading resource for practicing physicians and allied health professionals engaged in patient-centered medical imaging, let no one dare call what he’s done “yellow journalism,” though.


    The opinions expressed in InPractice magazine are those of the author(s); they do not necessarily reflect the viewpoint or position of the editors, reviewers, or publisher.

  • What’s Next for Us in Radiology?

    What’s Next for Us in Radiology?

    avatar

    Ruth Carlos

    2019-20 ARRS President

    In November 1982, AJR author Duncan Neuhauser wrote, “Just on the horizon are elaborate artificial intelligence diagnostic programs.” Back then, the price of gas averaged $1.22 a gallon and, for the first time ever, Time magazine’s “Man of the Year” was a literal object: the computer. Some 37 years ago now, as far back as I can tell, Neuhauser’s article (aptly titled “Careful Thinking”) was the first time those two words—“artificial intelligence”— appeared side-by-side in the yellow journal.

    Neuhauser’s event horizon ran long. Breaking Moore’s law, too, the words “artificial intelligence” wouldn’t reunite on the page in AJR for another five years, when Thomas Spackman and Kerry Bensman finally weighed in. Pointing out that radiology “has accepted computers and computer systems more completely than most other medical specialties have,” they also noted in the May 1987 issue that future PACS or DIMS (i.e., digital image management systems) “will require the novel application of expert systems and artificial intelligence, fields in which most radiologists have little experience.

    What a difference the decades make. Here at the dawn of 2020, Spackman and Bensman would be hard-pressed to find any board-certified radiologist without at least cursory exposure to artificial intelligence or working fluency with AI-adjacent algorithms like radiomics, predictive analytics, etc. For ARRS, AJR, or even our speciality at large, AI exposure and fluency are no longer the most pressing issues; access to the full suite of once and future AI technologies is.

    Both for today and for tomorrow, three distinct points of entry remain: coordination, location, and remuneration. Firstly, are our patients receiving convenient appointments for appropriate screening and diagnostics? Moreover, exactly where are these imaging facilities located, and can patients physically get to said facilities safe and sound? And, ultimately, will our patients still be able to afford whatever AI-assisted imaging care looks like in 2025 or 2030?

    Gone from our Earth forever are the so-called days of “unfettered wholesale imaging”. In its place, I hope, will stand a nononsense rubric of relevance versus reimbursement for whomever orders the clinical decision—be they man, woman, machine, or any mix thereof.

    One thing I do know for sure: In 2020 and beyond, radiologists will need to step out of the reading room and possess the complete value chain, from initial scheduling to clinician action. To quote Teddy Roosevelt—who occupied the White House when AJR was founded—“the credit belongs to the man who is actually in the arena…”


    The opinions expressed in InPractice magazine are those of the author(s); they do not necessarily reflect the viewpoint or position of the editors, reviewers, or publisher.

  • Mass Casualty Incidents: An Introduction for Imagers

    Mass Casualty Incidents: An Introduction for Imagers

    avatar

    Mark P. Bernstein
    Clinical Associate Professor, Trauma and Emergency Radiology
    NYU Langone Medical Center and Bellevue Hospital

    The events of the Columbine school shooting in 1999, the attacks on September 11, 2001, and the anthrax mailings the following week underscored the need for health care to be prepared to respond to acts of mass violence and bioterrorism.

    Many health care systems developed disaster preparedness plans, assuming that treatment would be delivered according to established standards of care with sufficient resources and facilities to serve their communities. However, with each subsequent mass casualty event it became apparent—at least in the immediate response, referred to as the “surge”—that resources were overwhelmed and delivery of health care to established standards was compromised. Consequently, health care systems needed to review and revise their disaster management plans with newly identified issues and renewed preparations.

    Mass casualty incidents (MCIs) are not defined by number of victims or severity of injuries, but rather by an imbalance of supply and demand. Therefore, the definition is fluid, dependent upon the demand for and availability of limited resources to provide optimal care for a population of casualties.

    The World Health Organization defines a mass casualty incident as “an event which generates more patients at one time than locally available resources can manage using routine procedures. It requires exceptional emergency arrangements and additional or extraordinary assistance.” The key message being that there is no threshold.

    Multiple Casualties vs Mass Casualties

    In daily operations of normal emergency care, there is an abundance of resources in relation to patient load. In this setting, health care follows our routine standard of care operations. When the emergency department experiences an influx of multiple patients in a short period of time, without overwhelming resources, this is simply a busy shift. In this multiple casualties scenario, although extra resources may be marshaled, there is no significant deviation from normal standard of care. In contrast, a mass casualty results from a rapid patient load that quickly overwhelms available resources with necessary changes to the delivery of care.

    MCIs may be natural, in the form of tornadoes, hurricanes, or floods; or they may be accidental, such as a building collapse or train crash; or they may be intentional, including mass shootings, riots, or explosive detonations. What MCIs share, however, is that these events are uncommon, unpredictable, and often occur without warning. Thus, responding to these events requires planning and practice.

    The Greatest Good for the Greatest Number

    The goal of health care in an MCI is optimizing outcomes for the greatest number of patients. Accordingly, changes in the usual standards of care are imperative to achieve this goal. Rather than doing everything possible to save every life, it will be necessary to allocate limited resources in a different manner, due to overwhelming demand. Those resources include operating rooms (ORs), interventional radiology (IR) suites, ventilation equipment, blood products, physical space in the emergency department, and imaging equipment—to name just a few.

    To that end, several considerations need to be addressed, including:

    • How should current standards of care be altered in response to an MCI to save as many lives as possible?
    • What is the minimal acceptable care?
    • What issues and principles should guide the planning of a medical response for an MCI?
    • What information, tools, and resources are available to address the needs of planners?
    • When and how are non-trauma centers integrated into the response and care for an MCI?

    Many disaster management plans do not provide guidance concerning altered standards of care necessary to respond to an MCI. Allocation of limited resources should be considered and planned for to ensure that access is both clinically sound and just.

    Triage: Red, Green, or Yellow?

    Triage is the act of sorting patients according to severity of injury, likelihood of survival, and availability of resources. It is a dynamic process, as resource accessibility changes (e.g., running out of ORs) and as patient condition changes (e.g., patient responds to fluid resuscitation and tourniquet application; conversely, a once stable “walking wounded” patient has suddenly decompensated). Moreover, triage needs to be flexible enough to respond to changes in MCI type and magnitude.

    The sorting process serves to identify those patients in need of immediate medical attention, tagged red; patients with minor injuries that can clearly wait (i.e., walking wounded), tagged green; and patients who are tagged neither red nor green. These yellow-tagged patients require urgent, though not immediate medical care, repeat physical examinations, and often benefit from imaging to improve triage accuracy.

    Human resources should also be considered, along with physical resources, to ensure a prolonged supply of qualified staff. Such considerations include staff transport into and out of the facility, nourishment, protection, adequate rest, and stress management.

    Avoiding the Bottleneck

    Multiple studies report CT and portable x-rays have created consistent bottlenecks during MCIs. Brunner J, Rocha TC, Chudgar AA, et al. The Boston Marathon bombing: after-action review of the Brigham and Women’s Hospital emergency radiology response. Radiology 2014; 273:78–87

    Campion EM, Juillard C, Knudson MM, et al. Reconsidering the resources needed for multiple casualty events: lessons learned from the crash of Asiana airlines flight 214. JAMA Surg 2016; 151:512–517

    Mueck FG, Wirth K, Muggenthaler M, et al. Radiological mass casualty incident (MCI) workflow analysis: single-centre data of a mid-scale exercise. Br J Radiol 2016; 89:20150918

    Dick EA, Ballard M, Walker HA, et al. Bomb blast imaging: bringing order to chaos. Clin Radiol 2018; 73:509–516
    To prevent the radiology bottleneck, imaging should be integrated into the MCI protocol.

    The role of imaging is to improve triage accuracy: identify life threatening injuries to determine who is most in need of critical resources, including the OR, IR suite, or other life-saving measures. Detailed diagnosis at this stage to identify each and every rib fracture is not the mission in an MCI. Keep in mind that if the purpose of casualties coming to a hospital is to access such lifesaving resources, then a process modifier, such as imaging, should not be the rate-limiting step forming a bottleneck.

    Essential radiological tasks are threefold: first, identify surgical and interventional cases; second, communicate critical results; and third, reduce over-triage to the OR.

    During the surge, imaging should be limited to yellow-tagged and select red-tagged patients (those awaiting OR to prioritize).

    Radiography during the surge phase of an MCI should be limited to portable chest x-rays to prevent misuse of non-emergent radiographs while other patients are waiting. No other radiographs should be allowed, until clearance from the senior triage physician.

    CT scanning during the surge should be limited to high-priority hemodynamically stable patients and those responding to resuscitation.

    Consider limiting scan protocols to a single whole-body CT (WBCT) to eliminate variation for optimal efficiency and greatest throughput. Imaging in an MCI is a departure from daily practice. CT is a limited-resource triage modifier and should always be viewed as such to prevent a bottleneck.

    Imaging strategies include: a dedicated radiologist stationed at the CT console for immediate review; use of a paper form for critical imaging results; “no frills” WBCT protocols to eliminate immediate post-processing of multiplanar reformations, in favor of volume reading on a dedicated CT workstation, where possible; and consideration of thicker image slices, if scanner processing and/or hospital network is slow. Remember that spinal precautions can be maintained until after the surge, and reconstructions can be performed later, as necessary.

    It is important to recognize that although CT usage during the MCI surge will be selective and may be altogether avoided, CT volumes will predictably increase post-surge. Post-surge imaging in an MCI may take up to 72 hours to complete; ensure staff are available beyond the initial phase.

    Integration Is Preparation

    Mass casualty events are increasing in frequency, creating stress on the hospital system as a whole, including the radiology department. Because dealing with an MCI presents a departure from routine standard of care, radiology must be incorporated into the hospital’s overall disaster management plan. Considering and understanding the issues the radiology department faces, as well as the role radiologists play in planning for these incidents, is vital for saving lives and improving outcomes.

    The question is no longer if, but rather when, your department will become involved in some capacity. The need to be prepared is self-evident, and history has shown this requirement applies to all practice types, yet the integration of imaging into the MCI response remains a relatively novel concept—and can seem like an overwhelming one.

    When planning and preparing for hospital-based medical care during disasters and mass casualties, radiologists must act as subject matter experts on the crucial role imaging plays. Proper integration can help develop a ready and resilient response that optimizes efficient and effective care while conserving vital resources.


    The opinions expressed in InPractice magazine are those of the author(s); they do not necessarily reflect the viewpoint or position of the editors, reviewers, or publisher.