
Claudia M. Muns
University of Puerto Rico School of Medicine

lejandra Cardona
Department of Internal Medicine, San Juan City Hospital, Puerto Rico

Efrén J. Flores
Department of Radiology, Massachusetts General Hospital
Despite the advancements in diagnosis and treatment, lung cancer (LC) remains the leading cause of cancer-specific mortality with an estimated 235,760 new cases and 131,880 deaths in 2021 [1]. Although LC affects all races and ethnicities, disparities in LC outcomes and mortalities exist. Barriers related to medical and sociodemographic factors, including language, access to smoking cessation resources, LC stigma, and health literacy, among other social determinants of health, are factors that play a role in the existing disparities in the LC care continuum [2, 3]. Lung cancer screening (LCS) can serve as a pillar to bridge disparities in LC outcomes through primary risk reduction with smoking cessation and secondary risk reduction with LCS [4]. However, despite the proven benefits of LCS in reducing LC mortality, only a fraction of the eligible population has been screened, and the proportion of individuals eligible for LCS among underserved populations is likely to be lower [5]. The ongoing COVID-19 pandemic, which has exacerbated health disparities among racial/ethnic minority communities and other underserved communities, has resulted in diversion of medical resources to address immediate needs [5, 6]. The effects of postponing nonurgent medical care, including LCS, because of the pandemic are unknown. Without targeted outreach, the low participation rates and delays in LCS will widen existing disparities in LC outcomes among underserved communities [6].
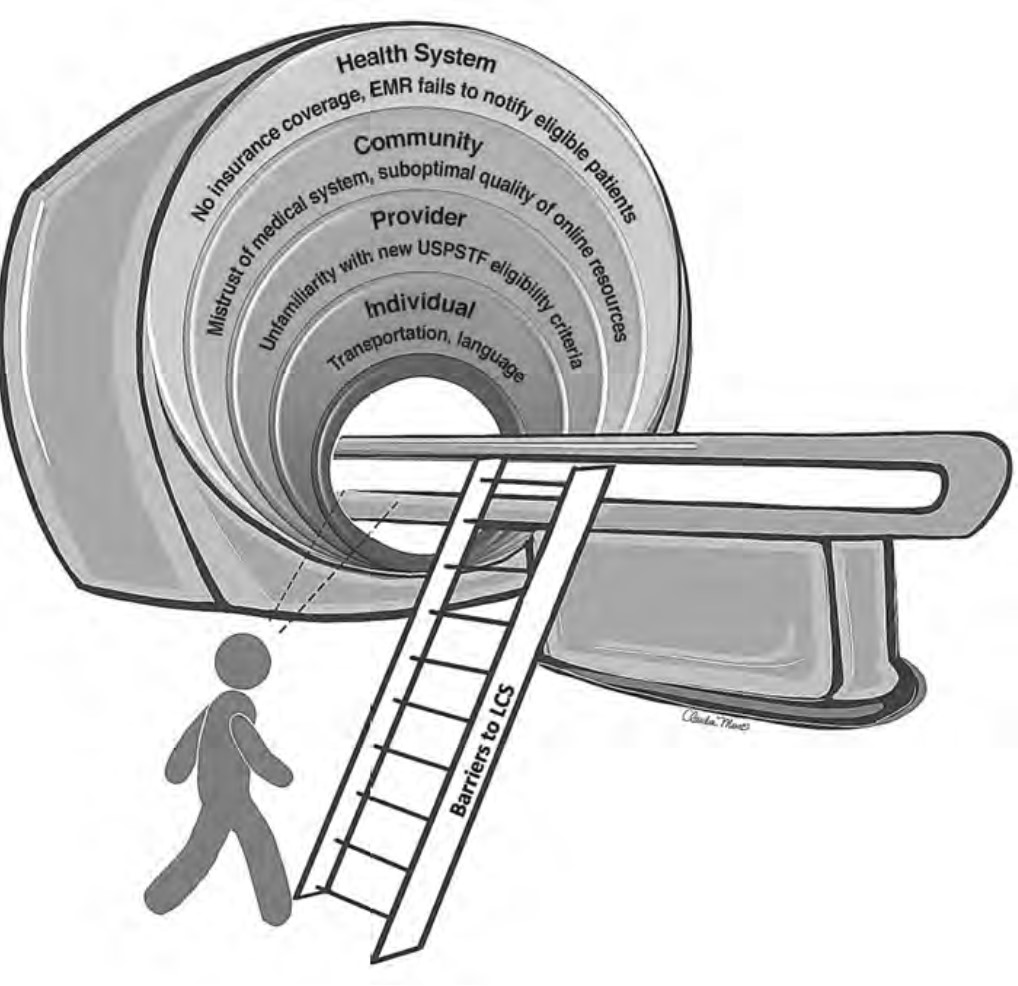
The recent update in the U.S. Preventive Services Task Force (USPSTF) LCS eligibility guidelines lowers the required smoking history to 20 pack-years and age to 50 years [7]. This provides an opportunity to improve overall LCS participation rates among diverse patient populations through tailored approaches that consider barriers related to social determinants of health. Therefore, it is vital that we take steps to understand barriers to LCS and develop targeted multilevel outreach interventions to increase LCS participation rates. The purpose of this InPractice piece is to use a modified social-ecologic model of barriers to LCS (Fig. 1) to discuss multilevel interventions and advance equity in LCS uptake among diverse patient populations by increasing awareness, opportunities, and participation in LCS (Table 1). This framework can be adapted to advance equity in LCS among radiology practices in different settings.
Barriers to and Facilitators of Lung Cancer Screening Awareness
Barriers
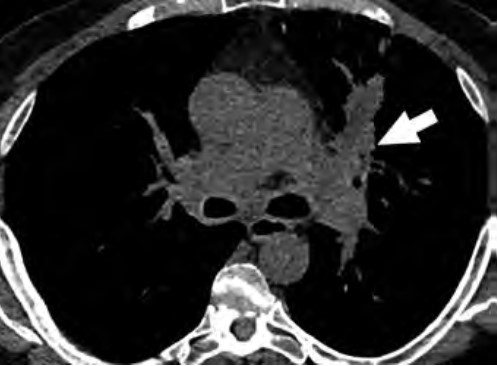
At the individual level, some of the barriers to awareness include unfamiliarity with LCS as a health preventive service tool (Fig. 2), unawareness of the new USPSTF and Centers for Medicare & Medicaid Services (CMS) recommendations for LCS, unfamiliarity with insurance coverage and costs, uncertainty about available accredited LCS programs, lack of culturally appropriate information, and lack of information at an appropriate health literacy level [8–10].
At the provider level, unfamiliarity with the new USPSTF and CMS recommendations and identifying patients who are eligible under the new guidelines for LCS are substantial barriers reported in the literature [9–11]. Other barriers at the provider level include unfamiliarity regarding where to refer patients; unfamiliarity with insurance coverage; lack of knowledge about available resources for management of abnormal LCS findings and follow-up of incidental findings; and skepticism about the benefits of LCS, given that clinical trials recruited predominantly White non-Hispanic patients with a higher socioeconomic status than that of the general U.S. population [10].
At the community and health care system level, suboptimal quality of institutional information about LCS (i.e., information not tailored for the surrounding communities) and a lack of institutional social media presence or engagement through social media campaigns to disseminate information about LCS are barriers to LCS [12, 13]. Furthermore, electronic medical records (EMRs) that are not optimized to automatically notify providers of eligible patients have been reported as a barrier [10].
Facilitators
At the individual level, facilitators for LCS are creating patient-centered, culturally tailored educational content to increase interventions to raise awareness and increase health literacy about the new guidelines and fostering non-stigmatizing language and guidelines from national organizations such as the International Association for the Study of Lung Cancer (IASLC) [4, 10, 12, 14]. An effort must be made to inform patients about the importance of early LC detection through LCS, the availability of insurance coverage, and the location of nearby LCS centers using websites such as the “Lung Cancer Screening Locator Tool” [10, 15]. Community health fairs, conventional media, social media, educational brochures, and mailed invitations are examples of how LCS educational information can be disseminated in multiple settings [10]. The educational material can be tailored to focus on hope based on the advancements in LC treatment by including patient testimonials about their experiences with LCS and by tailoring the education to fit the needs and capacities of diverse populations [10, 16]. Online content can provide information and details about LCS programs in multiple languages at the recommended health literacy levels [13]. The Internet and the use of social media can play a key role in the dissemination of information regarding LCS [17]. Prior studies have shown that digital awareness strategies leveraging social media were effective in increasing LCS engagement [17].
At the provider level, unfamiliarity with expanded eligibility criteria and where to refer patients for LCS can be addressed through educational webinars, institutional online resources, and provider-specific educational material that offers continuing medical education credits [18–21]. All these resources will address unfamiliarity with eligibility criteria, skepticism about the benefits of LCS, lack of awareness about LCS insurance coverage, and concerns related to the management of LCS findings [9, 10].
At the community and health care system level, an important facilitator to LCS is updating EMR systems to identify patients who are eligible for LCS under the new guidelines. This information can be incorporated into EMR systems with alerts for eligible high-risk patients, autopopulated referral tools, and lists of certified LCS centers that will help identify eligible patients and promote uptake among diverse patient populations [10, 22]. Online content can facilitate LCS by providing information about LCS programs that is tailored for the local communities served by radiology practices and health care institutions [10, 12]. Furthermore, implementing institutional social media campaigns that emphasize the expanded new eligibility criteria will help overcome knowledge gaps and barriers to awareness [23].
Barriers to and Facilitators of Lung Cancer Screening Opportunities
Barriers
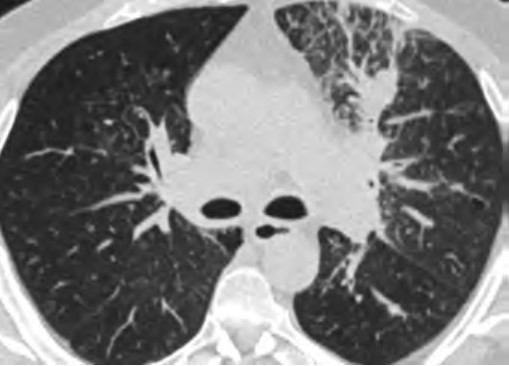
At the individual level, some of the barriers include decreased opportunities to provide accurate smoking history in the EMR, cost concerns related to insurance coverage of LCS and subsequent followups (Fig. 3), challenges to understanding LCS results when examinations show abnormal findings, fragmentation of care for management of abnormal LCS results and incidental findings, and difficulties navigating the complexities of health care systems [4, 8, 10]. Cost transparency and cost concerns are areas of active research, because cost influences how patients access and use health services [2]. For example, a recently published study evaluated the out-of-pocket cost of invasive procedures after LCS and showed that the rates of invasive procedures in commercially insured populations exceed those of invasive procedures in clinical trial participants [2].
At the provider level, some of the barriers include difficulty identifying patients who meet eligibility criteria, understanding the influence of comorbidities on the LCS eligibility criteria, and lack of assistance with following up on results [4, 10]. Additional barriers at this level include inconsistent documentation of smoking history, insufficient time to conduct shared decision-making because of other medical responsibilities, difficulty accessing multilingual decision-making aids, and anticipation of patient emotions about participating in LCS [4, 9, 10].
At the community and health care system level, some of the barriers are lack of health insurance coverage for LCS under the new USPSTF guidelines and barriers to telemedicine and broadband Internet access for conducting shared decision-making telehealth encounters. Uncertainty in defining the population-level health data of patients who meet eligibility criteria and would benefit from LCS, the absence of American College of Radiology (ACR)–accredited radiology practices performing LCS in communities, and a lack of community-based strategies to increase participation among underserved communities are additional barriers at this level [4, 5, 8, 10].
Facilitators
At the individual level, facilitators of opportunities for LCS include increasing the opportunities to provide an accurate smoking history through educational campaigns and additional opportunities in other health encounters to capture LCS eligibility information [24]. For identifying LCS-eligible patients, leveraging teachable moment and care coordination strategies during existing routine appointments can be effective. A previous study showed that among women undergoing screening mammography who were given a brief survey to assess LCS eligibility, only a small fraction of LCS-eligible women had undergone LCS [25].
Facilitating care coordination and overcoming transportation barriers can provide additional opportunities for patients to undergo LCS [4, 26]. For example, same-day screening appointments at the time of other medical appointments have been shown to be beneficial to patients who have trouble with transportation, taking time off from work, and finding assistance with dependent care, and this strategy could be expanded to be offered to patients eligible for LCS [27]. Concerns about the costs of LCS can be alleviated by providing information about expected costs related to LCS and by offering information about diverse financial support options provided by institutions. People who are uninsured or have concerns about out-of-pocket expenses related to LCS can be referred to community health care workers and patient navigators who can assist patients in identifying grant funding and institutional financial assistance programs to cover LCS among patients who do not have insurance or have a low income [22, 28]. Health care workers can also assist patients in navigating the complexities of the health care system and clarify additional questions related to their LCS results [22].
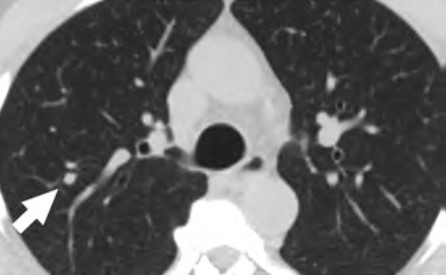
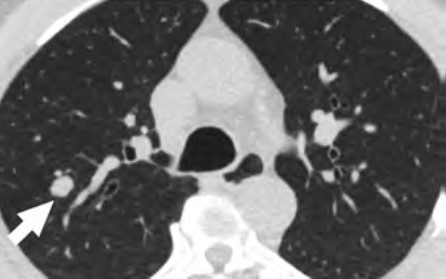
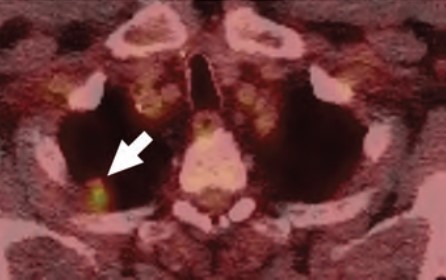
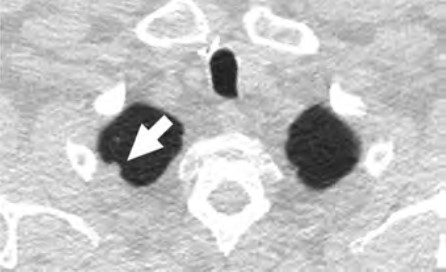
At the provider level, LCS can be leveraged as an opportunity to advance early LC detection and tobacco cessation. Primary care providers can benefit from training on shared decision-making encounters for the initial enrollment in LCS to gain further knowledge and expertise about tobacco cessation; the safety of tobacco cessation medications; and additional benefits of LCS with low-dose CT, such as coronary artery calcium scoring and evaluation of emphysema, among others [16, 29]. Prior studies have shown that additional findings such as interstitial lung disease, severe coronary artery disease, thyroid cancer, and renal masses can have clinical implications among patients undergoing LCS [29, 30]. Other facilitators are explaining the LCS results to the patient by identifying and addressing most concerning factors to them and incorporating an assessment in the decision-making process with a patient-centered approach [31]. In addition, creating EMR-based dashboards and alert systems that assist primary care practices in identifying patients who are eligible for LCS, particularly under the updated USPSTF guidelines, will provide additional opportunities for patients and providers to engage in conversations about participating in LCS [10]. Other facilitators can be addressing the importance of consistent documentation of smoking history, multilingual decision aids, and educational workshops or seminars to optimally manage incidental findings and address patient concerns related to undergoing LCS [24].
At the community and health care system level, facilitators of opportunities include the development of system-level policies that combine the updated USPSTF guidelines for LCS and consider social risk factors affecting patients and their communities to promote equitable LCS use and advocacy efforts that increase telehealth and patient portal access by increasing broadband Internet access points and digital patient navigators among underserved communities [5, 7, 10, 12, 17]. Including social risk factors in the calculation used for new LC risk models and LCS eligibility criteria can potentially benefit racial and ethnic minority groups and other underserved patient populations [4]. Increasing access to information about local accredited LCS centers and optimizing EMR systems to identify population-level health data of eligible patients under the new guidelines are additional facilitators to aid in removing these barriers [10, 15, 22].
Barriers to and Facilitators of Lung Cancer Screening Participation
Barriers
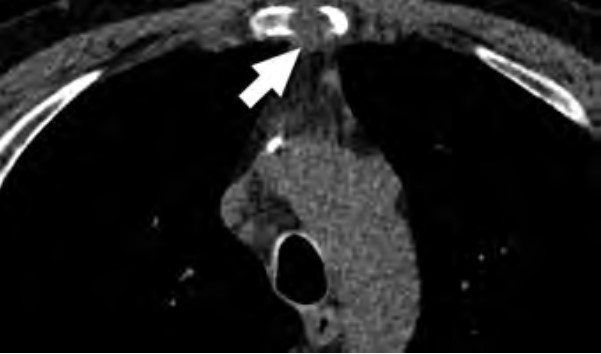
At the individual level, barriers to participation include conflicting personal and health schedules, such as medical appointment times that conflict with working hours, dependent care schedules, understanding the importance of adherence to annual LCS and recommended follow-up (Fig. 4) for the detection of early LC, anxiety and stigma about LC diagnosis, concerns about radiation exposure, and access to primary care services to get LCS referrals [4, 9, 10, 26].
At the provider level, barriers to participation include a lack of locally accessible LCS centers or LCS centers outside the health care system that do not offer a streamlined referral and follow-up process, lack of public transportation access to get to appointments, and lack of systemwide patient navigators or health care workers who can aid primary care providers in ensuring patients undergo LCS and help track adherence to recommended follow up of results [4, 10, 26].
At the community and health care system level, barriers include EMR-based LCS appointment reminders that are not available in multiple languages or that are available only through patient portals, decreased availability of system-based dashboards that will alert patients and providers about adherence to follow-up of abnormal LCS examinations, lack of accessible smoking cessation services for patients who smoke, and lack of access to multidisciplinary lung nodule clinics to assist patients in management of abnormal LCS findings [4, 10, 32].
Facilitators
At the individual level, facilitators of participation for LCS include providing schedule flexibility by offering off-hours appointments during weekends and evenings or collaborating with community organizations to offer resources and promote screening during social events in the communities [28, 33]. Providing transportation to LCS appointments, such as ride sharing or cab vouchers, or providing access to mobile LCS units can assist patients in overcoming transportation barriers that could lead to missed LCS appointments [10]. To improve participation, providers can collaborate with radiology practices in communicating the importance of LCS and can promote follow-up through reminders sent to patients, which have been shown to increase LCS adherence [34]. The ACR National Lung Cancer Roundtable (NLCRT) launched a campaign to decrease the stigma associated with a LC diagnosis and decrease concerns about radiation exposure [35–37]. Increasing access to LCS clinics that offer an integrated approach to LCS in collaboration with primary care practitioners can assist in overcoming barriers related to a lack of access to primary care practitioners [38, 39].
At the provider level, facilitators include increasing the availability of community health care workers and patient navigators who can aid primary care practices to assist patients in participating in LCS [40].
Patient navigators can assist primary care providers in conducting shared decision-making, identifying and confirming LCS eligibility of patients, and assisting patients in clarifying additional steps or concerns needed to engage in LCS [40]. Collaboration between radiology and primary care practices can lead to offering integrated LCS programs that have streamlined referral pathways for LCS independent of practice location [38, 39]. In addition, LCS radiology programs that collaborate with primary care providers and community organizations to offer LCS, smoking cessation services, and screening for other cancers can be opportunities to increase participation in LCS and meet other population health preventive service goals [41, 42].
At the community and health care system level, facilitators of opportunities include EMR-based LCS appointment reminders available in multiple languages and through additional services other than patient portals, updating population-level health dashboard alerts of patients who are eligible or overdue for LCS under the new USPSTF guidelines, and creating system-based alerts to notify providers about newly eligible patients [10, 34]. Studies that have evaluated LCS adherence rates, patient characteristics associated with adherence, and diagnostic testing rates after screening revealed that underrepresented racial/ethnic minority populations and individuals who currently smoke are less likely to remain in the program [32]. Patients who undergo LCS and are currently smoking can benefit from the integration of smoking cessation counseling services into part of their LCS encounters, and participation in LCS increases adherence to a smoking cessation program [43]. Interventions that combine promoting participation in LCS and connecting patients who are current smokers with an evidence-based intervention composed of a web-based program and text messaging, are examples of a coordinated approach that increases participation in both LCS and smoking cessation [43, 44]. Finally, for assisting patients who have abnormal LCS results, improving telehealth access, increasing the capacity of smoking cessation services, and implementing a tailored approach with multidisciplinary lung nodule clinics for the management of abnormal LCS results and EMR dashboards that automatically track adherence to follow-up and outcomes can provide a system-based care coordination that will aid these patients in accessing LC care [38, 45–47].
To advance equitable participation in LCS and achieve the population health goal of improving LC outcomes for all patients through early detection, it is paramount that multilevel interventions are tailored to fit the needs and capacities of diverse patient populations served by all types of community practices. To achieve this goal, transdisciplinary system-based programs and interventions are key to address systemic barriers, improve access and uptake of LCS, and improve LC outcomes primarily among underserved patient populations. As radiologists and promoters of the health and well-being of our patients, partnering with patients, community organizations, and other medical specialties to assist patients in overcoming multilevel barriers to LCS will allow us to design sustainable programs to promote awareness of, opportunities for, and participation in LCS for all patients.
References
- NIH website. SEER Program. Cancer stat facts: lung and bronchus cancer. seer.cancer.gov/statfacts/html/lungb.html. Published 2021. Accessed November 12, 2023
- Febbo J, Little B, Fischl-Lanzoni N, et al. Analysis of out-of-pocket cost of lung cancer screening for uninsured patients among ACR-accredited imaging centers. J Am Coll Radiol 2020; 17:1108–1115
- Wang GX, Pizzi BT, Miles RC, et al. Implementation and utilization of a “pink card” walk-in screening mammography program integrated with physician visits. J Am Coll Radiol 2020; 17:1602–1608
- Flores EJ, Irwin KE, Park ER, Carlos RC. Increasing lung screening in the Latino community. J Am Coll Radiol 2021; 18:633–636
- Doubeni CA, Simon M, Krist AH. Addressing systemic racism through clinical preventive service recommendations from the US Preventive Services Task Force. JAMA 2021; 325:627–628
- Van Haren RM, Delman AM, Turner KM, et al. Impact of the COVID-19 pandemic on lung cancer screening program and subsequent lung cancer. J Am Coll Surg 2021; 232:600–605
- U.S. Preventive Services Task Force. Final recommendation statement: lung cancer—screening. www.uspreventiveservicestaskforce.org/uspstf/recommendation/lung-cancer-screening. Published March 9, 2021. Accessed November 12, 2023
- Ford JG, Howerton MW, Lai GY, et al. Barriers to recruiting underrepresented populations to cancer clinical trials: a systematic review. Cancer 2008; 112:228–242
- Trauth JM, Jernigan JC, Siminoff LA, Musa D, Neal-Ferguson D, Weissfeld J. Factors affecting older African American women’s decisions to join the PLCO Cancer Screening Trial. J Clin Oncol 2005; 23:8730–8738
- Wang GX, Baggett TP, Pandharipande PV, et al. Barriers to lung cancer screening engagement from the patient and provider perspective. Radiology 2019; 290:278–287
- Wang GX, Neil JM, Fintelmann FJ, Little BP, Narayan AK, Flores EJ. Guideline-discordant lung cancer screening: emerging demand and provided indications. J Am Coll Radiol 2021; 18:395–405
- Coughlin JM, Zang Y, Terranella S, et al. Understanding barriers to lung cancer screening in primary care. J Thorac Dis 2020; 12:2536–2544
- Gagne SM, Fintelmann FJ, Flores EJ, et al. Evaluation of the informational content and readability of US lung cancer screening program websites. JAMA Netw Open 2020; 3:e1920431
- International Association for the Study of Lung Cancer (IASLC) website. IASLC language guide. www.iaslc.org/IASLCLanguageGuide. Published May 2021. Accessed November 12, 2023
- American College of Radiology (ACR) website. Lung cancer screening locator tool: screening location finder. www.acr.org/Clinical-Resources/Lung-Cancer-Screening-Resources/LCS-Locator-Tool. Published 2021. Accessed November 12, 2023
- Flores EJ, Neil JM, Tiersma KM, et al. Feasibility and acceptability of a collaborative lung cancer screening educational intervention tailored for individuals with serious mental illness. J Am Coll Radiol 2021; 18:1624–1634
- Jessup DL, Glover Iv M, Daye D, et al. Implementation of digital awareness strategies to engage patients and providers in a lung cancer screening program: retrospective study. J Med Internet Res 2018; 20:e52
- American College of Radiology (ACR) website. Lung cancer screening resources. www.acr.org/Clinical-Resources/Lung-Cancer-Screening-Resources. Accessed October 7, 2021. Accessed November 12, 2023
- American College of Radiology (ACR) website. Lung CT Screening Reporting & Data System (Lung-RADS). www.acr.org/Clinical-Resources/Reporting-and-Data-Systems/Lung-Rads. Published 2021. Accessed November 12, 2023
- LuCa National Training Network website. Enhancing provider education on lung cancer care. lucatraining.org. Published 2021. Accessed November 12, 2023
- American College of Radiology (ACR) website. National lung cancer roundtable lung cancer screening webinar series. pages.acr.org/2021-NLCRT-Webinar-Series.html. Published 2021. Accessed November 12, 2023
- Percac-Lima S, Ashburner JM, Rigotti NA, et al. Patient navigation for lung cancer screening among current smokers in community health centers a randomized controlled trial. Cancer Med 2018; 7:894–902
- Wang GX, Narayan AK, Park ER, Lehman CD, Gorenstein JT, Flores EJ. Screening mammography visits as opportunities to engage smokers with tobacco cessation services and lung cancer screening. J Am Coll Radiol 2020; 17:606–612
- Cardarelli R, Roper KL, Cardarelli K, et al. Identifying community perspectives for a lung cancer screening awareness campaign in Appalachia Kentucky: the Terminate Lung Cancer (TLC) study. J Cancer Educ 2017; 32:125–134
- Lopez DB, Flores EJ, Miles RC, et al. Assessing eligibility for lung cancer screening among women undergoing screening mammography: cross-sectional survey results from the National Health Interview Survey. J Am Coll Radiol 2019; 16:1433–1439
- Bieniasz ME, Underwood D, Bailey J, Ruffin MT 4th. Women’s feedback on a chemopreventive trial for cervical dysplasia. Appl Nurs Res 2003; 16:22–28
- Healio website. ‘I’ve never been treated so well’: same-day cancer screening program helps reduce barriers. www.healio.com/news/hematology-oncology/20210907/ive-never-been-treated-so-well-sameday-cancer-screening-program-helps-reduce-barriers. Published September 7, 2021. Accessed November 12, 2023
- CancerCare website. Financial assistance program. www.cancercare.org/financial. Published 2021. Accessed November 12, 2023
- Fan L, Fan K. Lung cancer screening CT-based coronary artery calcification in predicting cardiovascular events: a systematic review and meta-analysis. Medicine (Baltimore) 2018; 97:e10461
- Hatabu H, Hunninghake GM, Richeldi L, et al. Interstitial lung abnormalities detected incidentally on CT: a Position Paper from the Fleischner Society. Lancet Respir Med 2020; 8:726–737
- Schapira MM, Aggarwal C, Akers S, et al. How patients view lung cancer screening. the role of uncertainty in medical decision making. Ann Am Thorac Soc 2016; 13:1969–1976
- Barbosa EJM Jr, Yang R, Hershman M. Real-world lung cancer CT screening performance, smoking behavior, and adherence to recommendations: Lung-RADS category and smoking status predict adherence. AJR 2021; 216:919–926
- CDC website. Offering flexible hours and locations. www.cdc.gov/cancer/nbccedp/success/hours-locations.htm. Published 2021. Accessed November 12, 2023
- Hirsch EA, New ML, Brown SP, Baron AE, Malkoski SP. Patient reminders and longitudinal adherence to lung cancer screening in an academic setting. Ann Am Thorac Soc 2019; 16:1329–1332
- American Thoracic Society (ATS) website. American Thoracic Society and American Lung Association implementation guide for lung cancer screening. www.lungcancerscreeningguide.org. Accessed November 12, 2023
- International Association for the Study of Lung Cancer (IASLC) website. Feldman J, Faris NR, Warren GW. Ending stigma in lung cancer: the IASLC participates in a collaborative summit held by the National Lung Cancer Roundtable. www.iaslc.org/iaslc-news/ilcn/ending-stigma-lung-cancer-iaslc-participates-collaborative-summit-held-national. Published October 15, 2020. Accessed November 12, 2023
- Christiani DC. Radiation risk from lung cancer screening. Chest 2014; 145:439–440
- Okpala P. Increasing access to primary health care through distributed leadership. Int J Healthc Manag 2021; 14:914–919
- Joseph AM, Rothman AJ, Almirall D, et al. Lung cancer screening and smoking cessation clinical trials: SCALE (Smoking Cessation within the Context of Lung Cancer Screening) Collaboration. Am J Respir Crit Care Med 2018; 197:172–182
- Denver Health website. Module 3: healthcare team—community health workers and patient navigators. https://www.denverhealth.org/patients-visitors/community-voices-patient-navigators. Published 2011. Accessed November 12, 2023
- Headrick JR, Morin O, Miller AD, Hill L, Smith J. Mobile lung screening: should we all get on the bus? Ann Thorac Surg 2020; 110:1147–1152
- Atrium Health website. Levine Cancer Institute launches nation’s first mobile lung CT unit to improve care for region’s underserved and rural patient. atriumhealth.org/about-us/newsroom/news/2017/03/levine-cancer-institute-launches-nations-first-mobile-lung-ct-unit-to-improve-care-for-regions-unde. Published March 20, 2017. Accessed November 12, 2023
- Lococo F, Cardillo G, Veronesi G. Does a lung cancer screening program promote smoking cessation? Thorax 2017; 72:870–871
- Graham AL, Burke MV, Jacobs MA, et al. An integrated digital/clinical approach to smoking cessation in lung cancer screening: study protocol for a randomized controlled trial. Trials 2017; 18:568
- Massachusetts General Hospital website. Pulmonary nodule clinic. www.massgeneral.org/cancer-center/treatments-and-services/pulmonary-nodule-clinic. Published 2021. Accessed November 12, 2023
- MD Anderson Cancer Center website. Lung cancer screening clinic. www.mdanderson.org/patients-family/diagnosis-treatment/care-centers-clinics/cancer-prevention-center/lung-screening-clinic.html. Published 2021. Accessed November 12, 2023
- American College of Radiology (ACR) website. ACR designated lung cancer screening center. www.acraccreditation.org/centers-of-excellence/lung-cancer-screening-center. Published 2021. Accessed November 12, 2023