The math for pancreatic cancer screening has always been a tough pill to swallow. With an annual incidence of just 13 per 100,000 in the general population, traditional screening tests simply can’t function effectively at such a low prevalence. Fortunately, a new strategy is emerging: risk enrichment.
During the AJR Forum on Opportunistic Screening, Michael Rosenthal, MD, PhD, of Dana-Farber Cancer Institute outlined how we can utilize AI to flip the script on these stats. Instead of searching for a needle in a haystack, first, let AI shrink the haystack.
High-Risk Filter: The goal? Move the screening population from a risk of 13 per 100,000 more toward a risk profile of 0.5 to 1 per 100—a hundred-fold intensification. This mirrors the risk levels seen in known familial and genetic cohorts, where screening is already proven to save lives. Dr. Rosenthal describes a multi-layered “filter” approach:
Top Layer (low cost/low risk)—using both EMR and opportunistic imaging analysis to filter out low-risk individuals at the average-risk pool level
Deepening the Filter—as the pool narrows, clinicians can move toward more intensive and specific tools
Targeted Surveillance—final groups identified then receive direct surveillance: blood testing, stool testing, active imaging
AI Advantage: AI thrives in this “top-of-the-funnel” environment. And by analyzing vast amounts of data from existing records and imaging, it can provide the insight needed to identify high-risk subgroups…minus the cost and invasiveness of primary screening.
Bottom Line: In harnessing AI to identify these high-intensity risk groups within gen pop, finally, we’ll make active pancreatic cancer screening a clinical reality.
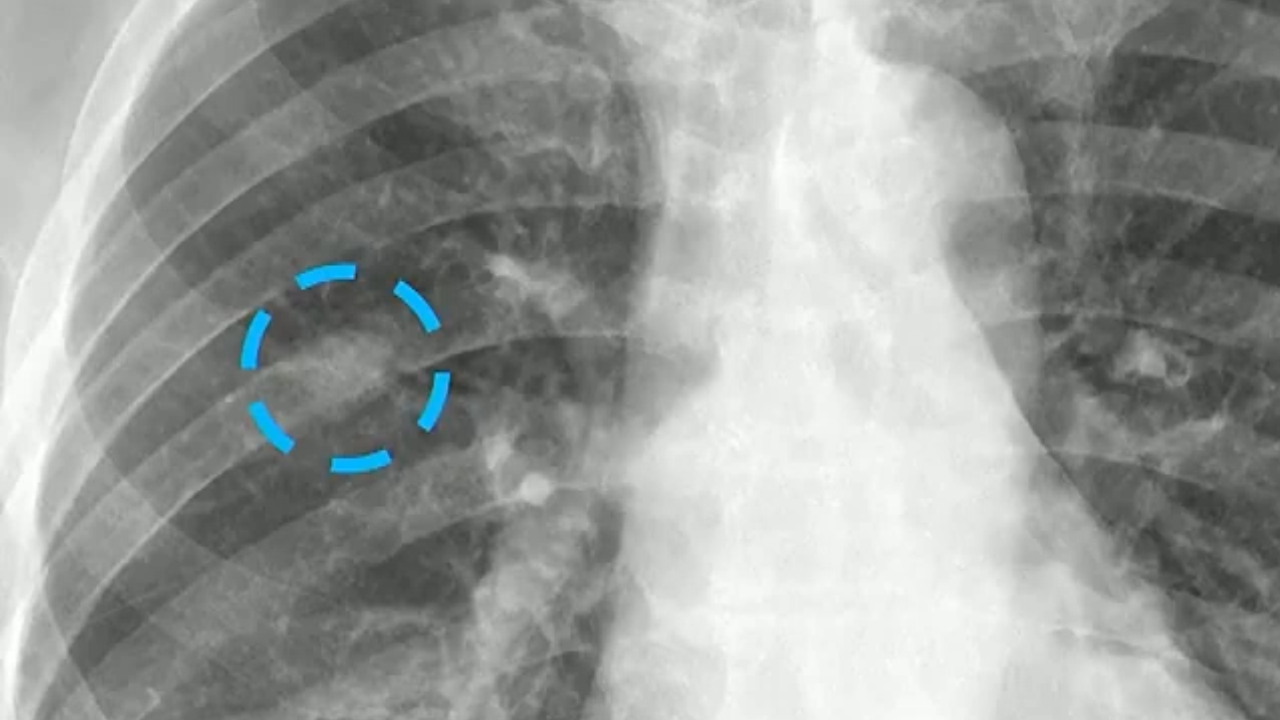
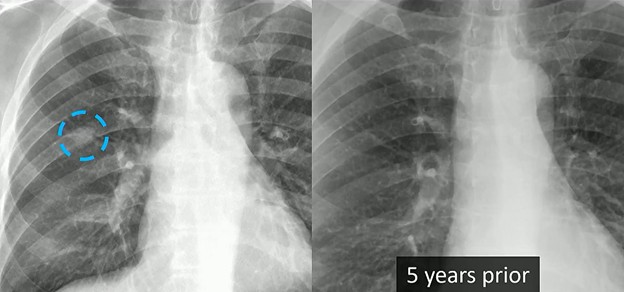
It’s the age-old CXR dilemma: “I don’t want to go to CT unless I have to!” But when a potential finding appears, how do chest rads decide if it’s really real or simply a summation of shadows?
Here, we do see a nodule in the right lung. And it certainly looks discreet. Could it be an abnormality within the overlapping rib? Perhaps. Could it be something on the patient’s skin? Maybe, but probably not.
According to Travis S. Henry, MD, professor of radiology and chief of cardiothoracic imaging at Duke, his approach to focal lung disease is decidedly inquisitive.
Is there volume loss?
Is there lymphadenopathy?
Is the finding chronic/recurrent?
The first line of questioning here, though? “Is there anything else?”
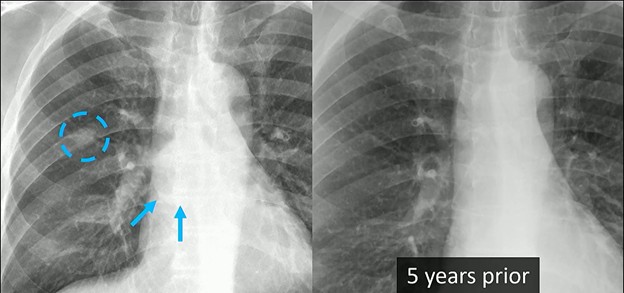
Finding associated abnormalities can turn a “maybe” into a “must-scan,” and in this case from Dr. Henry’s ARRS Web Lecture, a closer look reveals a huge subcarinal lymph node.
Clinical Context: The diagnostic weight of these findings increases significantly when combined with the patient’s history. This individual had a remote history of epithelioid angiosarcoma. While there was no known metastatic disease at the time, the combination of a new nodule and significant lymphadenopathy is highly concerning.
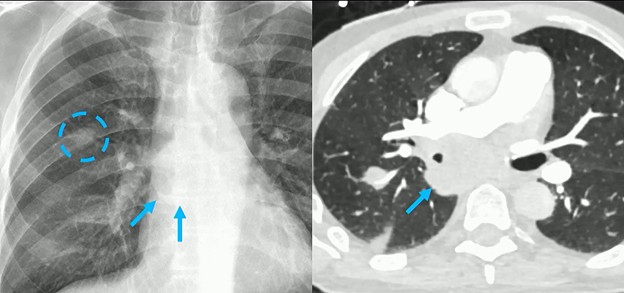
CT Correlation: Indeed, follow-up CT confirmed what the radiograph found:
The presence of that right lung nodule.
The massive subcarinal lymph node is clearly visible, showing exactly why the azygoesophageal interface was obscured.
Bottom Line: Rads mustn’t look at any nodule in isolation. Always search for secondary signs or associated findings to guide your next step.
When evaluating an intramedullary spinal cord lesion in a pediatric patient, your first instinct may be to consider ependymoma. In adults, that reflex is often correct; in children, the picture is more nuanced.
As Neil Lall, MD, noted during the ARRS Annual Meeting Radiology Case Review, ependymomas are the most common intramedullary spinal tumors overall, but they rank third in frequency in peds patients, making them less common in this age group than many trainees expect.
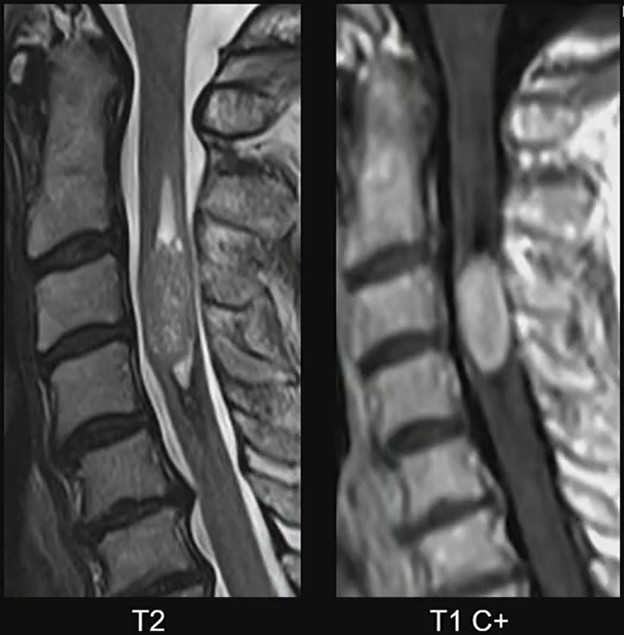
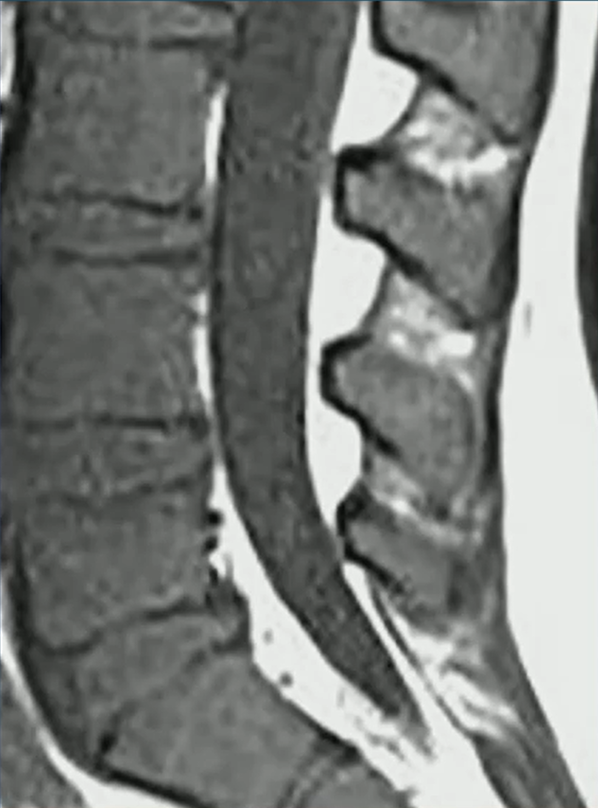
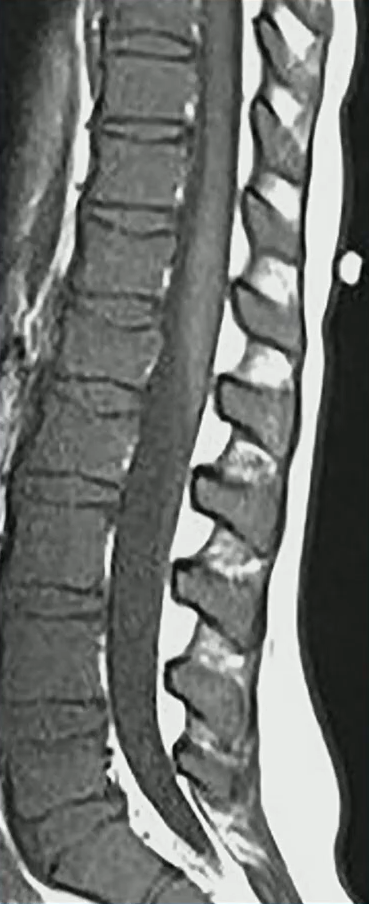
MRI Clues: In Dr. Lall’s case, the lesion demonstrates several classic characteristics:
Expansile intramedullary mass
Heterogeneously T2 hyperintense signal
Enhancing solid components
Well-demarcated margins
Short-segment spinal cord involvement
These features support the diagnosis of spinal ependymoma. The well-circumscribed margins are particularly helpful, reflecting the tumor’s relatively defined growth pattern compared with more infiltrative pediatric spinal tumors.
Peds Context: While ependymomas do occur in children, their presence should prompt consideration of an underlying genetic syndrome. One of the strongest associations is neurofibromatosis type 2 (NF2). Need a mnemonic? MISME syndrome captures the hallmark tumors associated with the disorder…
M—Multiple
I—Inherited
S—Schwannomas
M—Meningiomas
E—Ependymomas
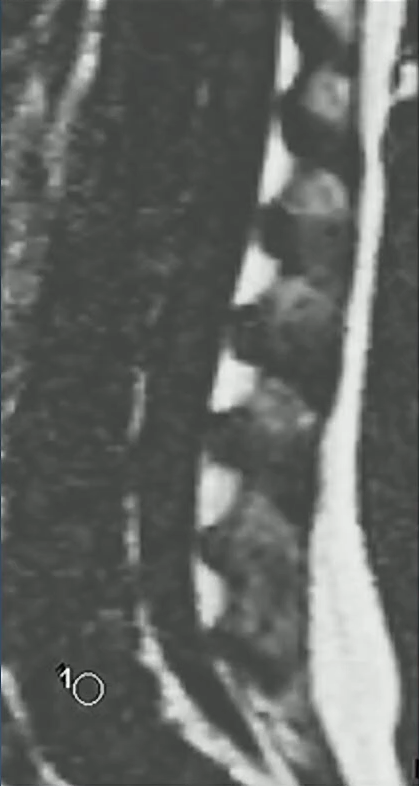
Diagnostic Focus: In this case, attention should remain on the cord lesion, rather than incidental degenerative changes. Distraction via unrelated findings (e.g., disc degeneration in an adolescent) can lead to misses, if the primary abnormality is not carefully evaluated.
Clinical Takeaway: Spinal ependymomas in children are uncommon but important to recognize. When an intramedullary mass appears expansile, well-defined, and enhancing, ependymoma should remain in the differential—and the possibility of NF2 should be considered.
Bottom Line: In pediatric spinal imaging, recognizing the pattern is only the first step. Understanding the syndromic context can be just as important as identifying the tumor, itself.
Well over a decade since ACR’s last lexical update, BI-RADS® v2025 Manual—née Atlas—truly reflects the tech, integrating the nomenclature of digital breast tomosynthesis (DBT), automated breast ultrasound (US), and contrast-enhanced mammography (CEM). Sure, adopting this latest manual can feel like “learning a new language,” but one of v2025’s standout features is modality-neutral terminology.
Informal, food-based descriptors for mammographic calcifications have retired, too. Out: “popcorn-like” and “milk of calcium.” In: precise descriptors, such as coarse and layering. Across all modalities, mass shapes are standardized: oval, lobulated (which has been reintroduced!), round, irregular. The mammographic descriptor “microlobulated” has been removed to prevent confusion with the shape descriptor “lobulated.” It’s replaced with indistinct.
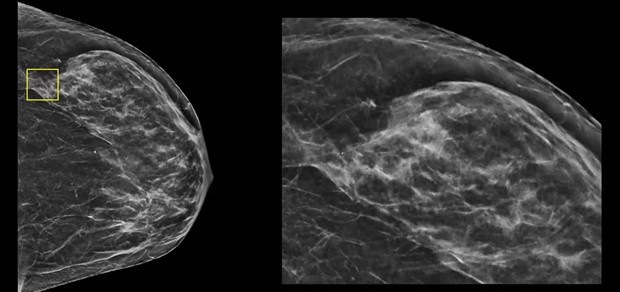
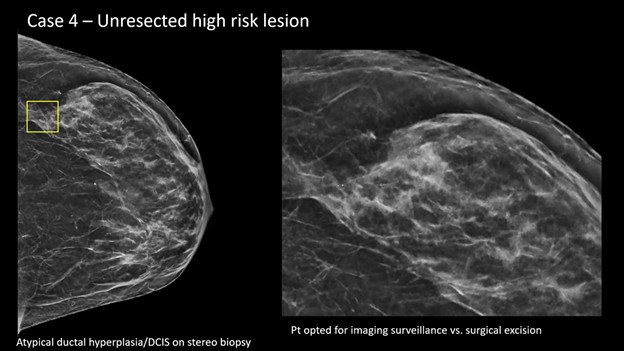
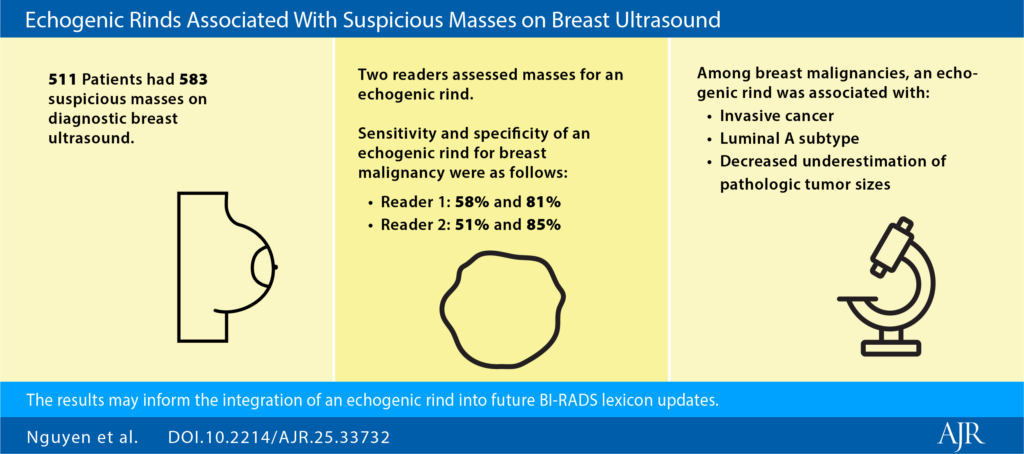
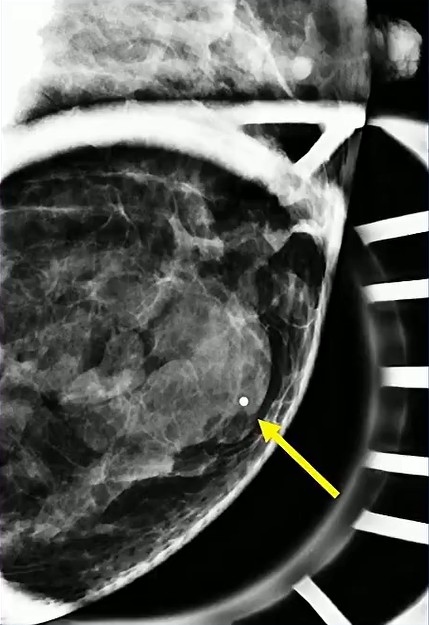
Presentation—A screening mammogram revealed subtle calcifications in the lateral aspect of the breast (yellow box). After magnification and stereotactic needle core biopsy, the pathology returned as atypical ductal hyperplasia (ADH), suspicious for ductal carcinoma in situ (DCIS).
Management Dilemma—Typically, surgical consultation and excision are recommended for this pathology. However, in this case, patient and surgeon alike opted for surveillance, instead of excision.
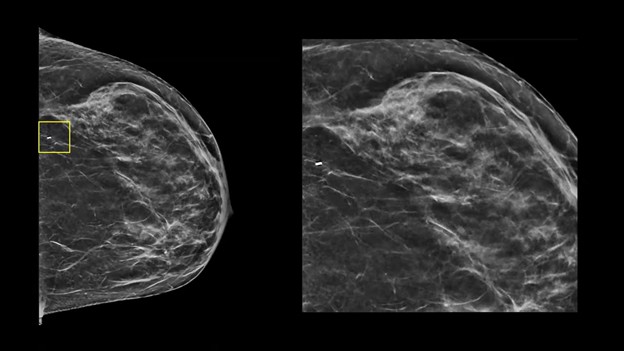
Reporting the Follow-Up—When a patient with an unresected high-risk lesion returns for surveillance (e.g., 6 months to 1 year later), your goal is active monitoring. Step 1: identify the titanium biopsy marker (yellow box) . . .
Step 2? Check for changes. Specifically, you’re looking for residual calcifications or any new areas of calcification.
II vs. IV—If the biopsy site and any residual calcifications remain stable over a designated period (as defined by your practice), you can safely assign a BI-RADS 2. Post-biopsy changes from a vacuum-assisted device are acceptable here, as long as you are comfortable with their stability.
If you see more calcifications on follow-up, you must assign a BI-RADS 4. This requires either repeating the needle biopsy or sending the patient back for a surgical excision consultation.
Cool To Be Rind: It’s worth noting that BI-RADS v2025 terminology now aligns more closely with contrast-based modalities via descriptors for nonmass lesions. Additionally, “echogenic rind”—a feature long known to be associated with malignancy—is officially included, with specific guidance for inclusion in your lesion measurements.
MRI & CEM Tweaks:
No “focus”for MRI; these findings should now be categorized as either small masses or background parenchymal enhancement (BPE).
“Multiple regions” is similarly removed for nonmass lesions, also better described as BPE.
Give the rise of ultrafast MRI, “early phase” replaces “initial phase.”
A new descriptor for T2-hyperintensity has been added as well.
Staging & Reporting:
BI-RADS 6 Extent-of-Disease: This Cat 6 definition allows for additional “close findings” (within 2 cm of a known malignancy) to be included if they would not change patient management.
Method of Detection: You are highly encouraged to document MOD to help track outcomes, demonstrate the benefits of early detection, and improve communication.
Temporal Shift: Finally, in a move toward purely morphologic assessment, descriptors that explicitly incorporate temporal change (i.e., “developing asymmetry”) have been removed. In AJR, Drs. Seely and Bissell warnthat this risks underemphasizing the diagnostic importance of temporal changes, so be sure to acknowledge such in your reports for appropriate management.
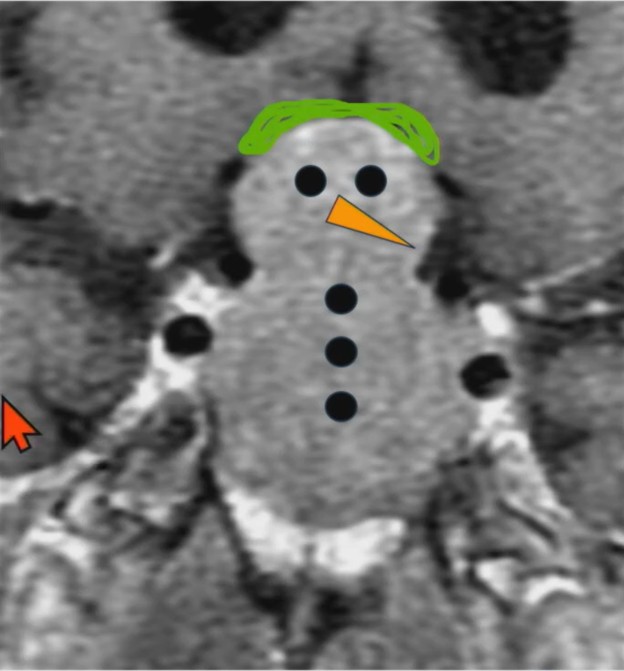
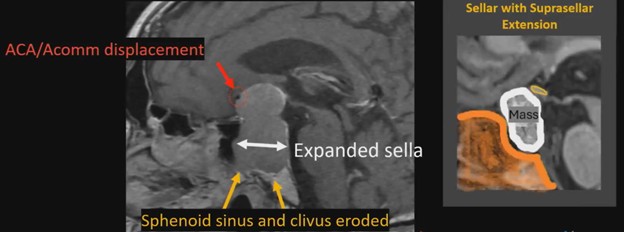
60-year-old with progressive vision loss for years, elevated prolactin
Do you wanna see a snowman? University of Mississippi neuroradiologist Charlotte S. Taylor, MD, illustrates a specific abnormality of the sella/suprasellar region in this ARRS Web Lecture—now available in your library.
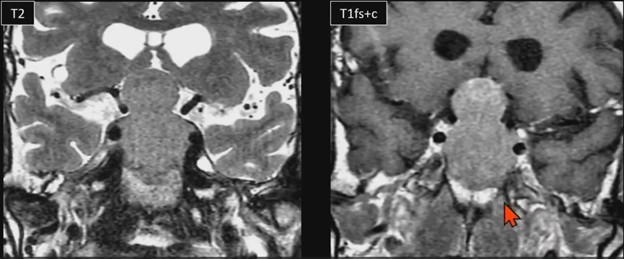
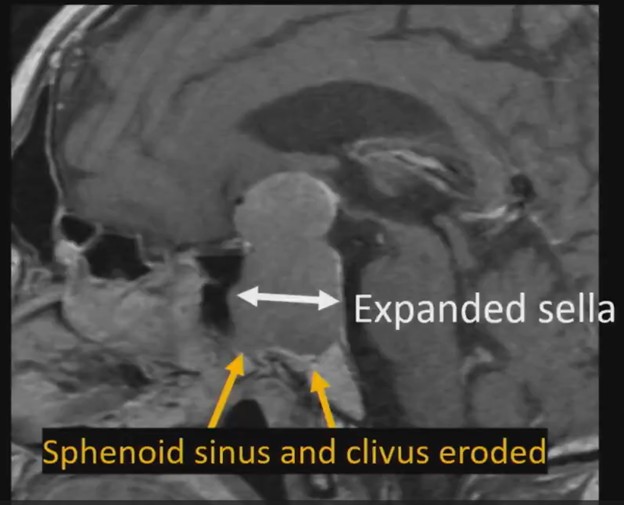
Waist Deep: When viewing a coronal or sagittal MRI of a classic pituitary macroadenoma (PM), you’ll often spot a snowman-shaped, homogeneously enhancing mass. This characteristic shape occurs due to a sella mass that develops a suprasellar extension, creating a “waist” as it pushes upward. In these pronounced cases, the normal pituitary tissue is usually completely displaced or obscured. You may also notice local bony involvement, including erosions in the sphenoid sinus and clivus.
Hat Trick: As the tumor extends superiorly, it exerts mass effect on the optic chiasm. The chiasm can become so severely stretched that it is difficult to visualize directly—effectively forming a sadly stretched “hat” resting atop our snowman’s noggin.
If the optic chiasm is too stretched to be seen clearly, look for the anterior cerebral arteries (ACA) and the anterior communicating arteries (Acomms). Because these vessels supply perforators to the optic chiasm, they are physically tethered to it. As these vessels are displaced superiorly by the mass, you can use ACA/Acomms as a reliable surrogate for location.
What About BHA? By definition, a PM measures 10 mm or greater in size. The non-functional variants are the most common and typically present due to visual disturbances resulting from the suprasellar mass effect. Whereas rads have been taught that pituitary adenomas cause true bitemporal hemianopsia (BHA), complete BHA is exceedingly rare, occurring in less than 1% of patients. Instead, incomplete bitemporal or mixed visual field defects are the most common presentation, seen in about 42.6% of patients. Notably, these visual field defects typically only occur when the tumor displaces the optic pathway by 3 mm or more.
Surgical Insight: Treatment for these lesions is generally surgical—most frequently an endoscopic transsphenoidal approach—with the notable exception of prolactinomas, which are treated medically using dopamine agonists. For surgical candidates, preoperative MRI features can help predict procedural success. Results from AJR show tumors with macrocysts, macrohemorrhage, or enhanced diffusivity (ADC ratio > 1.1) are highly resectable via transsphenoidal approach. Conversely, solid tumors with restricted diffusion tend to have a higher reticulin content, making them more rigid and more likely to fail transsphenoidal resection, perhaps requiring transcranial surgery.
Surveilling a Nonresected PM: For conservative patient management, the debate remains. Some experts argue gadolinium-based contrast agents are essential to assess tumor invasiveness, detect solid components, and evaluate markers of aggressive proliferation. And others counter that an unenhanced coronal T2-weighted MRI is perfectly adequate for tracking dimensions and optic compression, allowing your patient to avoid the costs, discomfort, and long-term retention risks associated with IV contrast.
Budd-Chiari syndrome is a disorder of hepatic venous outflow obstruction involving the accessory hepatic veins, major hepatic veins, or the suprahepatic inferior vena cava. Clinically, patients present with abdominal pain, hepatomegaly, and ascites—manifestations of sinusoidal congestion and portal hypertension.
The pathophysiology is straightforward: impaired venous drainage leads to hepatic congestion, rising sinusoidal pressures, and progressive liver dysfunction. However, as Baljendra S. Kapoor, MD, pointed out during this ARRS Quick Byte, the management algorithm is nuanced.
Baby Steps: Initial therapy is systemic anticoagulation. For patients with short-segment hepatic vein stenosis, balloon angioplasty with possible stenting is recommended, consistent with guidance from the American College of Gastroenterology.
When these approaches fail or are not feasible, the next-line intervention is Transjugular Intrahepatic Portosystemic Shunt (TIPS) placement. TIPS functions by creating a low-resistance channel between the portal and systemic venous systems, decompressing congested hepatic sinusoids and restoring effective outflow.
Recent Evidence: A meta-analysis of 1,395 patients published in JVIR demonstrated:
98.6% technical success
90.3% clinical success
0.5% TIPS-related mortality
These outcomes underscore both feasibility and safety. Much of the data derives from Asian cohorts, and randomized comparative trials remain limited, leaving questions about optimal patient selection and timing. Nonetheless, the existing evidence base supports TIPS as a highly effective salvage—and, in many cases, definitive—therapy.
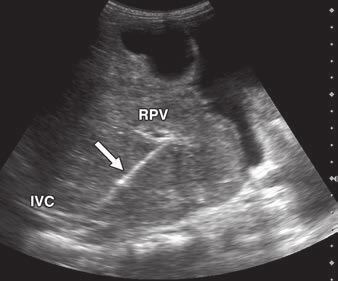
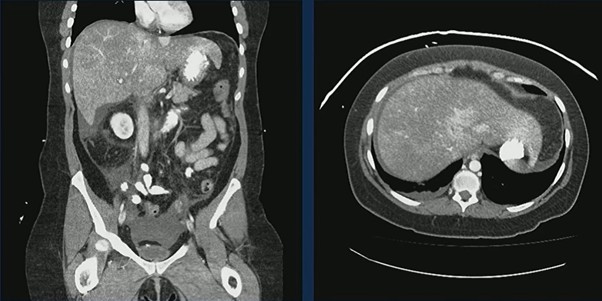
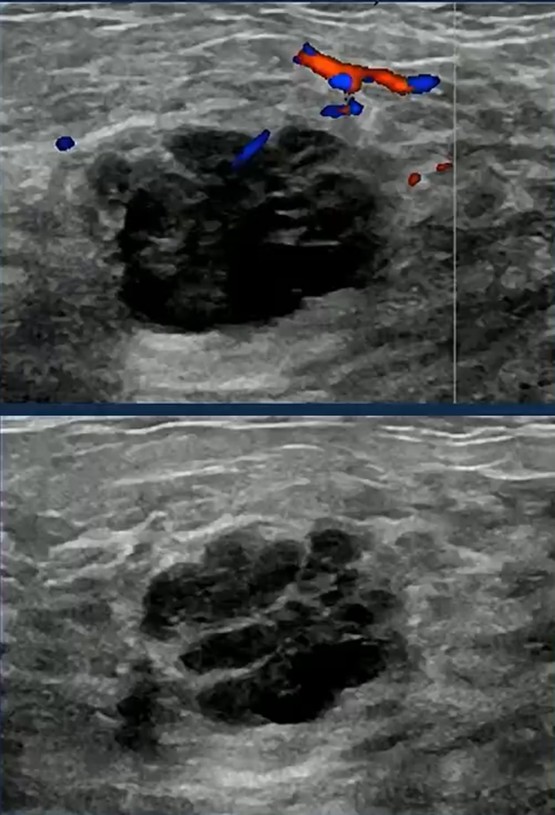
Case in Point: A 44-year-old woman with prior cerebrovascular accidents and paroxysmal nocturnal hemoglobinuria presented with abdominal pain, nausea, and vomiting. CT demonstrated an enlarged, heterogeneous liver with markedly heterogeneous enhancement and small-volume ascites—classic features of hepatic venous outflow obstruction.
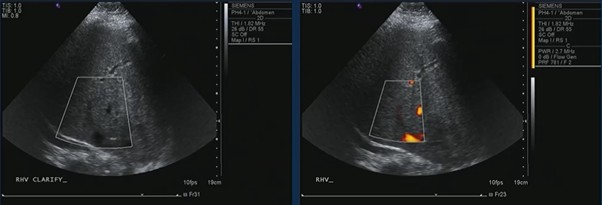
Ultrasound confirmed hepatic vein occlusion.
TIPS was successfully created, re-establishing outflow and decompressing the congested liver.
Clinical Inflection Point: Budd-Chiari management reflects a broader interventional principle…anticoagulate → recanalize, if possible → decompress, if necessary. For patients who fail medical therapy and angioplasty, TIPS is not merely palliative. It directly addresses the hemodynamic derangement driving symptoms and liver injury.
Bottom Line: Budd-Chiari syndrome is a vascular disorder with mechanical consequences. When hepatic venous obstruction persists despite anticoagulation and angioplasty, TIPS provides high technical success, strong clinical response rates, and low procedure-related mortality. In appropriately selected patients, decompression changes the trajectory of disease.
While ultrasound (US) remains the cornerstone of fetal screening due to its safety, real-time capabilities, and cost-effectiveness, occasionally, it meets its limits, too. In these instances, fetal MRI acts as a targeted problem-solving complement rather than a replacement, providing the clarity needed for high-stakes clinical decisions.
Safwan Halabi, MD, speaks with AJR Podcast Series host Raisa Amiruddin, MBBS, on techniques for detailed imaging of the developing fetus and the role of radiologists in the multidisciplinary fetal medicine team.
MRI Steps In: MRI is most frequently utilized when US raises questions that require deeper characterization in the following areas:
CNS Anomalies—MRI excels at evaluating the fetal brain, offering superior soft tissue contrast to visualize intricate details of cortical development, the corpus callosum, and posterior fossa structures.
Prognostic Quantification—For conditions like congenital diaphragmatic hernia, MRI provides precise measurements of fetal lung volume, which is a critical predictor of postnatal outcomes and candidacy for fetal surgery.
Complex Fetal Masses—In cases of masses like sacrococcygeal teratomas, MRI clarifies the internal composition and relationship to adjacent structures, which is essential for surgical and delivery planning.
Technical Hurdles: One of MRI’s greatest strengths is its independence from the technical limitations that often challenge US. MRI quality is not degraded by:
Fetal position or maternal body habitus
Low levels of amniotic fluid (oligohydramnios)
Maternal positioning, as mothers can often be adjusted within the scanner for comfort
Safety and Field Strength: Safety is a primary concern for expecting parents, of course. Routine fetal MRI uses no ionizing radiation and is performed without IV contrast, eliminating additional exposure concerns.
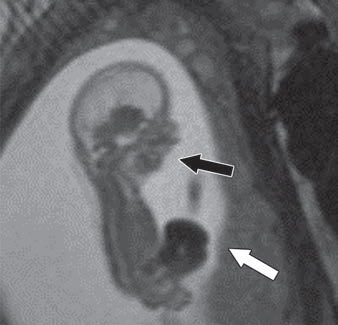
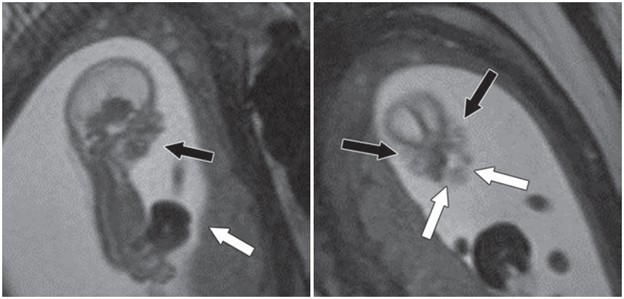
Fetus at gestational age of 13 weeks 0 days evaluated by MRI at 3T to characterize multiple congenital anomalies. Left, Sagittal 2D balanced SSFP image through entire fetus shows anterior abdominal wall defect with exteriorized liver (white arrow) and micrognathia (black arrow). Right, Coronal 2D balanced SSFP image through fetal face shows bilateral cleft lip and cleft palate (whitearrows) and hypertelorism (black arrows). Additional anomalies depicted by this fetal MRI examination (not shown) included bilateral cerebral ventriculomegaly measuring 10–11 mm and severe dextroconvex thoracolumbar scoliosis. Umbilical cord length was normal, arguing against limb–body wall complex despite presence in this case of numerous typical diagnostic elements of this condition.
While 1.5T has been the standard, many centers are transitioning to 3T MRI for its improved SNR and spatial resolution, particularly for early-gestation anatomy. Recent research published in AJR provides further reassurance, showing no significant differences in neonatal growth parameters (e.g., birth weight, head circumference) between neonates exposed to 1.5T, 3T, or no MRI in utero.
Shailin Thomas, MD, discusses the AJR article by Danzer et al. supporting the safety of fetal MRI performed at 3T based on neonatal anthropometric measurements.
Bottom Line: Fetal MRI is most effective when part of a multidisciplinary team approach. Rads provide the diagnostic “missing link,” working with maternal-fetal medicine specialists, neonatologists, and pediatric surgeons to translate complex images into a clear plan for the family. By identifying whether an anomaly is isolated or part of a larger syndrome, MRI helps guide the timing and mode of delivery, ultimately reducing parental anxiety during a critical time.
In the ICU, thoracic POCUS is most impactful when applied systematically. Two frameworks anchor its use in acute respiratory failure: the BLUE protocol and lung aeration scoring. Together, they provide rapid diagnosis and quantitative monitoring.
BLUE Protocol Structures Diagnosis: The Bedside Lung Ultrasound in Emergency (BLUE) protocol, developed by Lichtenstein and Mezière, standardizes lung ultrasound evaluation in patients presenting with acute respiratory failure. Core elements include:
Assessment of 2–3 predefined points per hemithorax
Identification of key sonographic patterns:
A-lines (normal aeration)
B-lines (interstitial syndrome)
Absent lung sliding
Consolidation
Adjunct venous ultrasound when pulmonary embolism is suspected
Rather than scanning the entire thorax, the protocol focuses on reproducible anatomical windows and interprets artifact patterns within a diagnostic algorithm. Validation studies report approximately 90.5% diagnostic accuracy in acute respiratory failure. BLUE’s strength lies in speed and structure, transforming artifact recognition into actionable bedside triage.
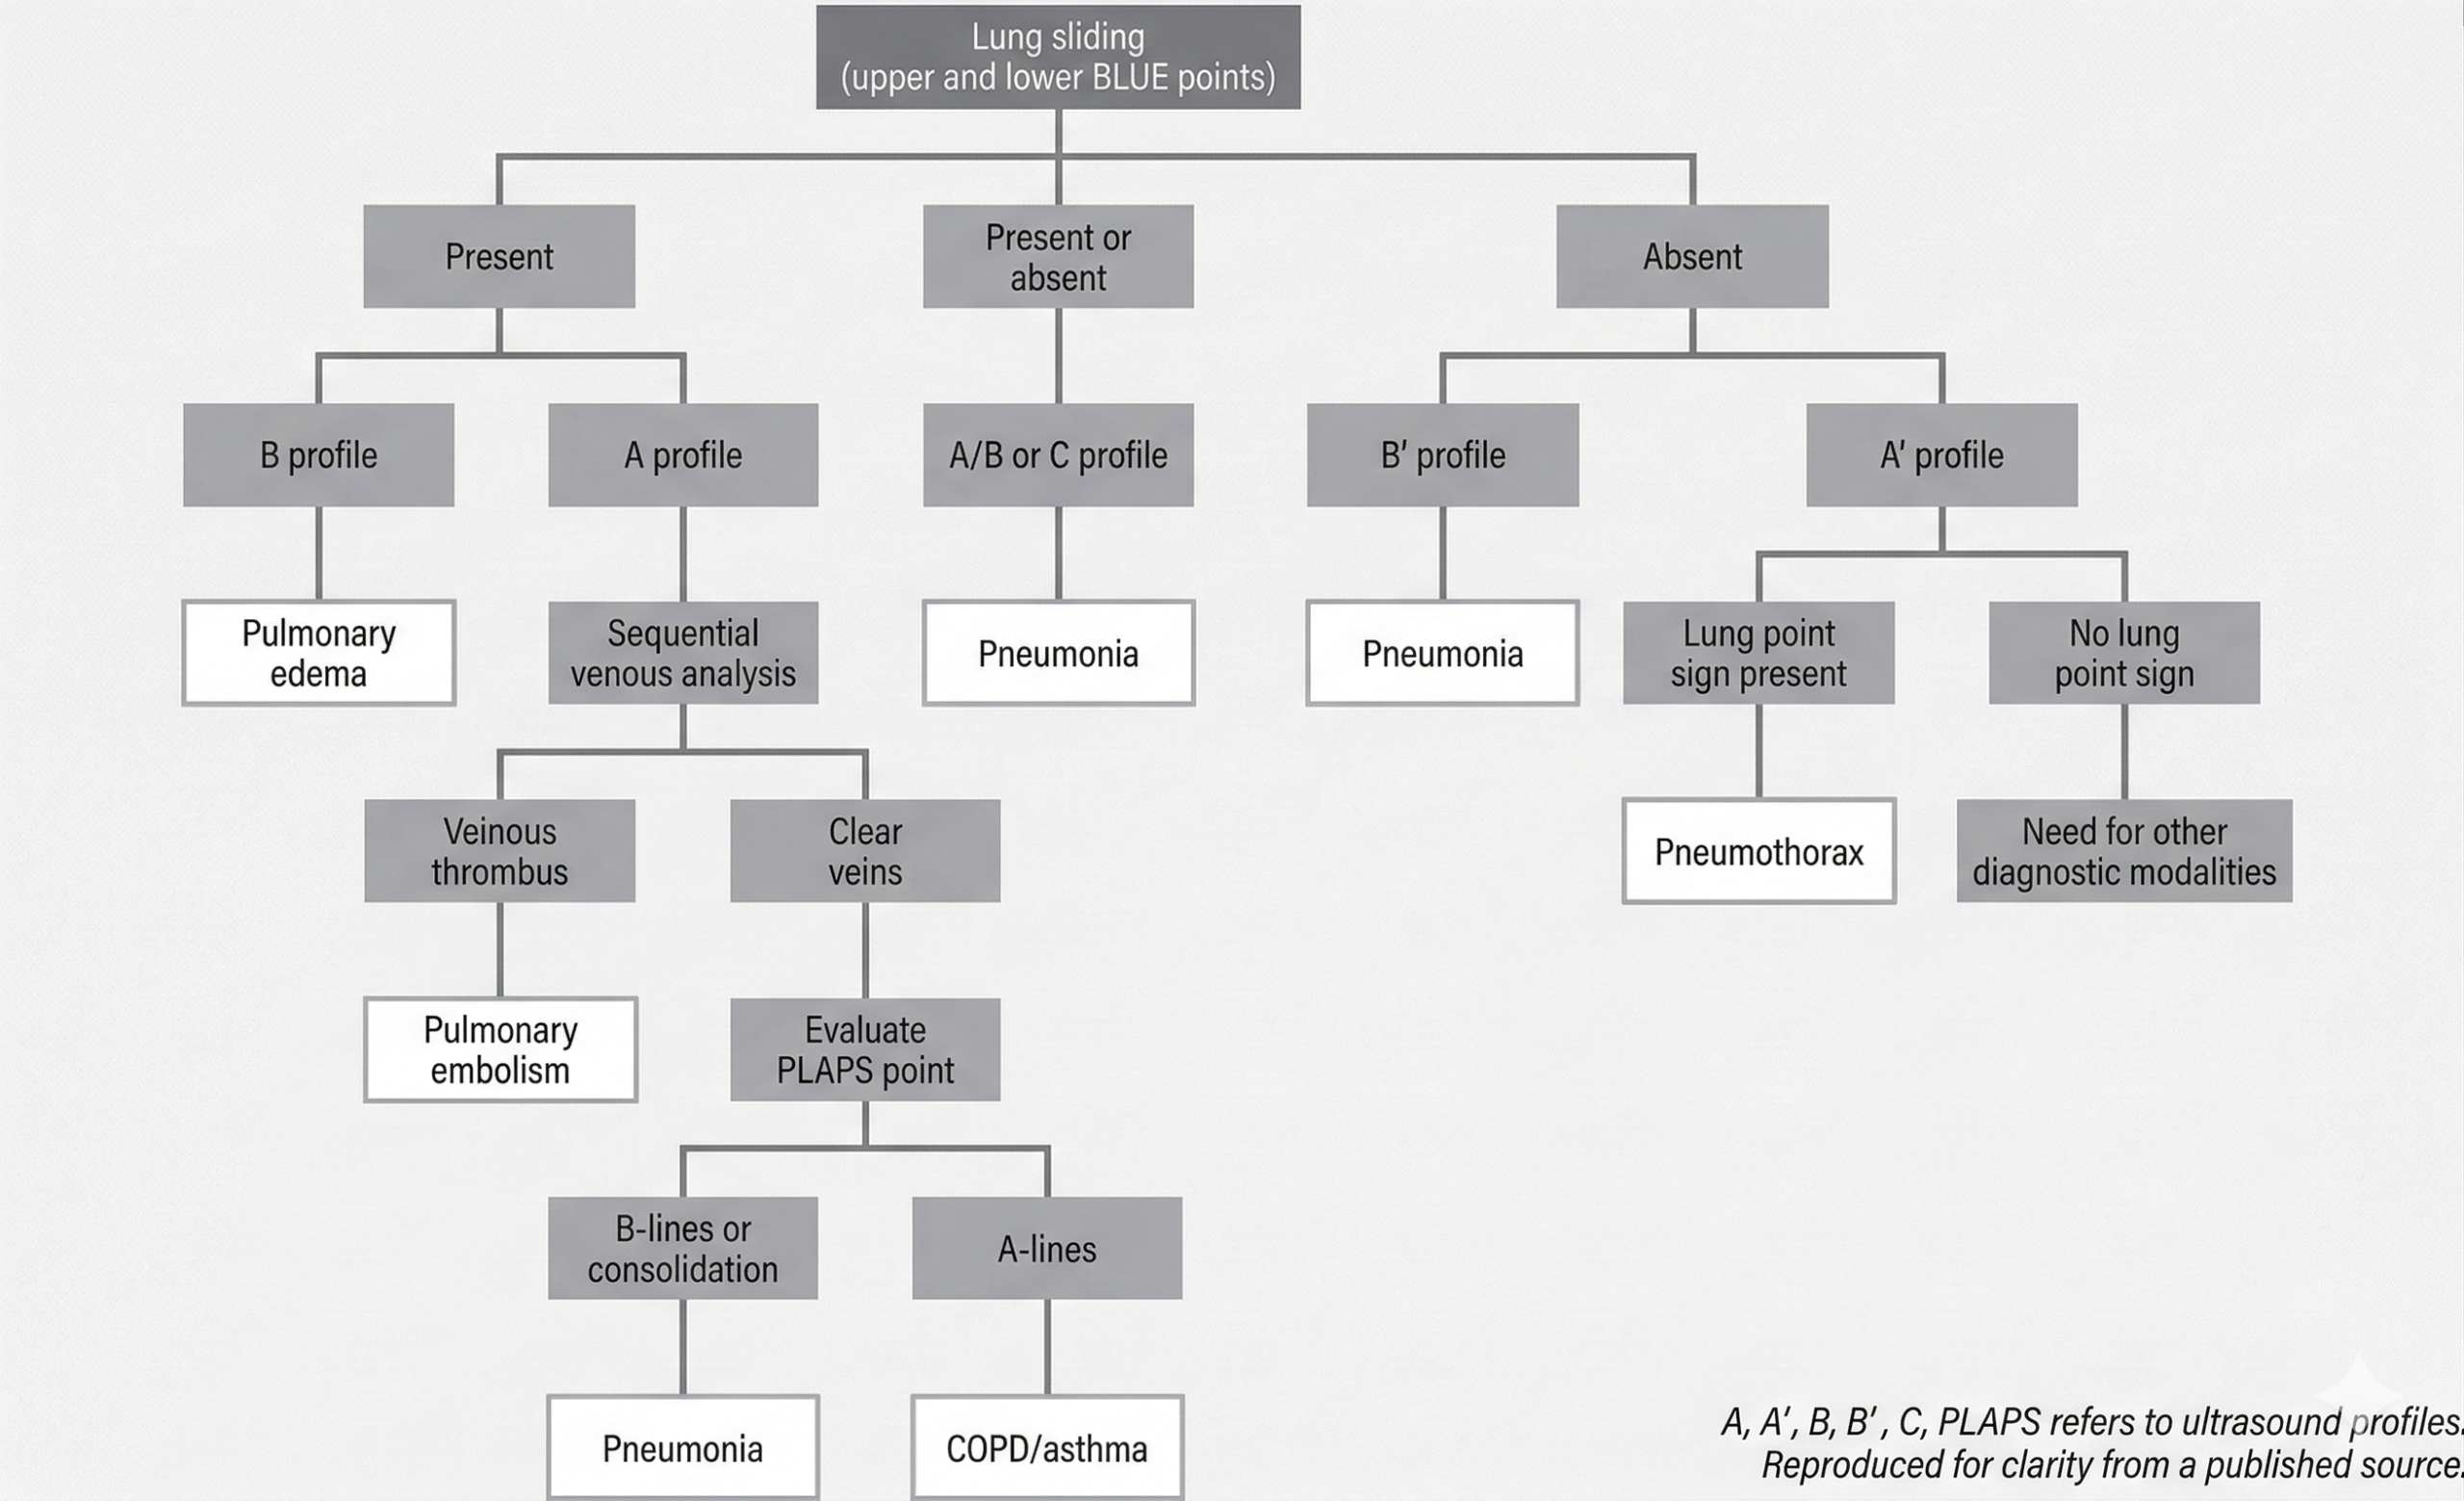
Chart summarizes bedside lung ultrasound emergency (BLUE) protocol as applied to patients with undifferentiated respiratory failure. This protocol includes two to three points: upper BLUE point (anterior below clavicle), lower BLUE point (anteriomedial between nipple and anterior axillary line), and posterior lateral alveolar/pleural syndrome (PLAPS) point (behind posterior axillary line at level of lower BLUE point). Diagnoses are indicated in white boxes. Designation of A profile means fewer than three B-lines are present in all imaged points and ultrasound is considered normal. B profile means more than three B-lines are present in multiple points and ultrasound is suggestive of pulmonary edema. C profile indicates consolidation, typically pneumonia. B’ profile indicates absent lung sliding with present B-lines, which suggests pneumonia. A’ profile indicates lack of lung sliding or B-lines suggesting pneumothorax. A/B profile indicates mix of A- and B-lines and suggests pneumonia.
Lung Aeration Assessment Quantifies Disease Burden: While the BLUE protocol classifies pathology, lung aeration scoring quantifies severity.This scoring system grades each lung region as follows:
0: A-lines or fewer than three B-lines (normal aeration)
1–2: Increasing B-line burden (partial loss of aeration)
3: Consolidation (complete loss of aeration)
Six regions per lung are evaluated, yielding a cumulative score from 0 to 36. Clinical applications include:
Monitoring pulmonary edema and response to diuresis
Assessing ventilator-associated pneumonia
Guiding PEEP adjustments
Predicting post-extubation respiratory distress
This approach enables longitudinal tracking. Instead of asking, “Is there edema?” clinicians can ask, “Is aeration improving?”
Complementary Roles: The two systems serve distinct but complementary purposes:
BLUE protocol → Rapid etiologic diagnosis
Aeration scoring → Severity assessment and treatment monitoring
Together, they represent a shift from qualitative bedside imaging to structured, reproducible, and semi-quantitative critical care ultrasound.
Clinical Takeaway: When applied correctly, thoracic POCUS is not an ad hoc scan; it is protocol-driven medicine. The BLUE protocol accelerates diagnosis in respiratory failure, whereas lung aeration scoring measures trajectory. In the ICU, this combination can change management within minutes.
Breast imaging during pregnancy demands heightened vigilance. Hormonal changes alter parenchymal appearance, masses can grow rapidly, and benign entities may closely mimic aggressive malignancies. Few examples illustrate this diagnostic tension better than the lactating adenoma, as Haydee Ojeda-Fournier, MD, explains during the ARRS Web Lecture “Breast Imaging: Special Patient Populations.”
Lactating adenomas are the second-most common mass encountered in pregnant and lactating patients. Imaging characteristics often mirror fibroadenomas and can be indistinguishable on both mammography and ultrasound. Therefore, definitive diagnosis typically depends on histology, rather than imaging alone.
These lesions are more frequently observed in the third trimester and often regress after delivery or once nursing begins—a reassuring natural history that supports conservative management when pathology confirms the diagnosis.
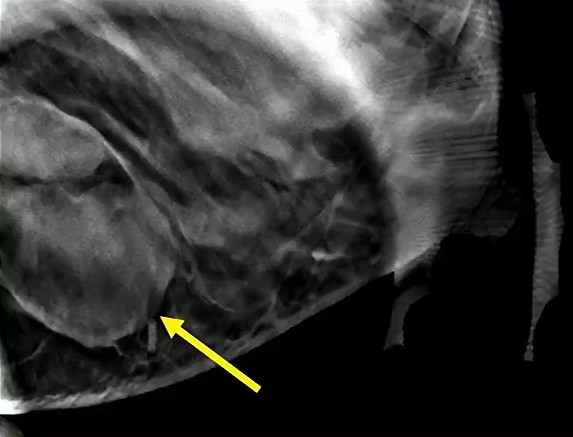
Solid Target: Physiologic lactational changes can introduce cystic elements, creating mixed solid–cystic morphology. When biopsy is indicated, precision matters: sampling the solid portion is essential to secure an accurate diagnosis and avoid false reassurance…as in the case of this 36-year-old postpartum patient (lump x 3 months) with biopsy-proved lactating adenoma.
Growth Raises Concern: Rapid enlargement should never be dismissed as purely hormonal. The differential remains broad, including phyllodes tumor, abscess, and malignancy.
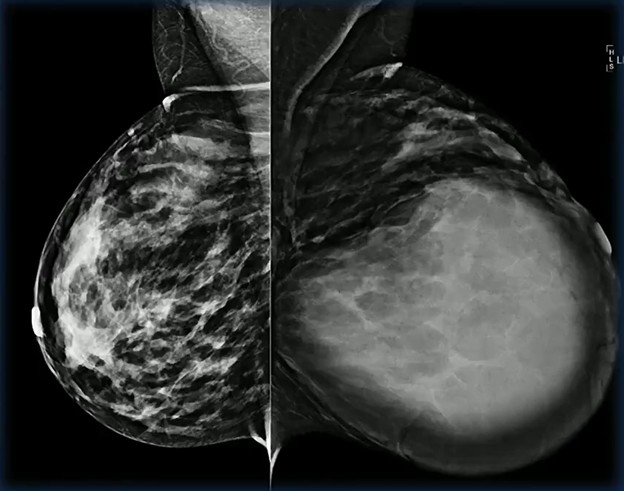
In this case involving a 29-year-old patient with a quickly enlarging mass, biopsy confirmed a lactating adenoma—reinforcing that benign lesions can behave dramatically during pregnancy.
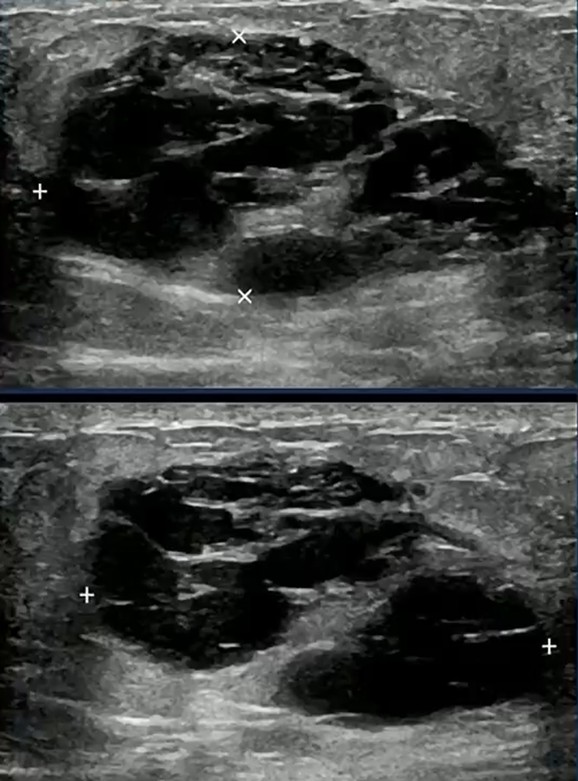
Diagnostic Trap! Consider the following scenario: two patients, both 39, both pregnant, both presenting with a mixed solid and cystic mass. One proves to be a lactating adenoma.
The other is triple-negative breast cancer. Imaging alone may not reliably separate the two.
This is the core interpretive hazard in special populations; pattern recognition must be paired with disciplined skepticism.
Pattern → Constraint → Advantage: Lactating adenomas frequently resemble fibroadenomas on imaging. → Mixed morphology and rapid growth can overlap with aggressive cancers, limiting imaging specificity. → Thoughtful targeting for biopsy and early tissue diagnosis convert uncertainty into clarity.
Clinical Takeaway: Pregnancy should lower the threshold for diagnostic rigor. Not raise it! When imaging features and clinical behavior diverge, tissue sampling is the safest path forward.
Bottom Line: In pregnant and lactating patients, the most dangerous mistake is assuming a reassuring pattern guarantees a benign process. Histologic confirmation remains the anchor of confident breast imaging in this population.
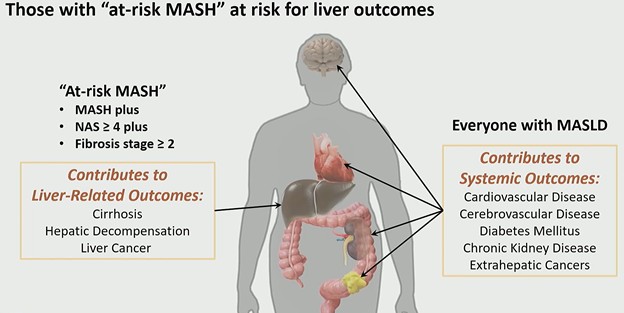
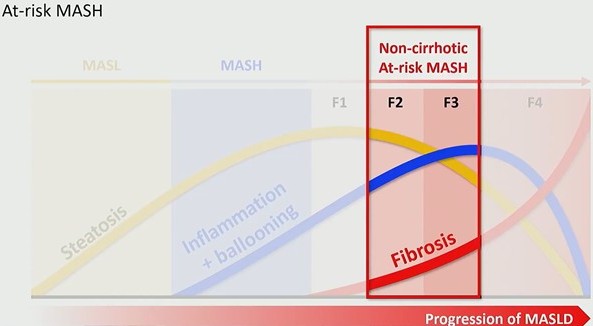
A new term is reshaping hepatology and radiology alike: at-risk MASH. As described by Claude B. Sirlin, MD, during the ARRS QuickByte “Latest Insights Into MASLD,” this subgroup represents patients with metabolic dysfunction–associated steatohepatitis (MASH) who have a nonalcoholic fatty liver disease (NAFLD) activity score ≥4 and fibrosis stage ≥2—the cohort most likely to experience liver-related outcomes and qualify for pharmacologic therapy.
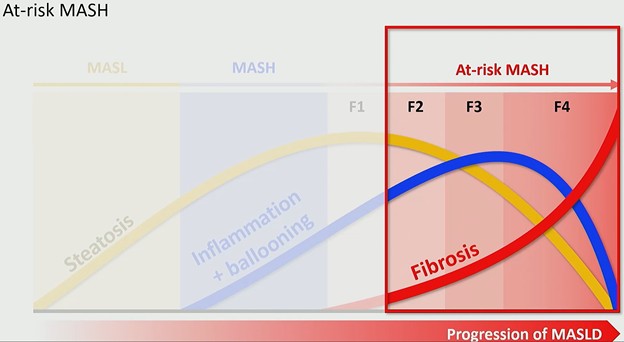
Why “At-Risk” Changes the Conversation: MASLD progresses along a biologic continuum:
Steatosis appears first and increases early.
Inflammation and ballooning signal transition to MASH.
Critically, as fibrosis advances, steatosis may decline—and in end-stage cirrhosis, fat may disappear entirely. This has major imaging implications. Proton density fat fraction (PDFF) is an excellent marker of steatosis and often correlates with MASH. But PDFF is not necessarily the best marker of at-risk MASH, because patients with significant fibrosis (stage ≥2) may demonstrate decreasing fat content.
In other words: less fat does not mean less risk.
A Therapeutic Threshold: The FDA approval of Resmetirom on March 14, 2024 marked the first pharmacologic therapy for MASH. However, this therapy is not broadly indicated. At approximately $50,000 per year, it is targeted specifically to patients with non-cirrhotic at-risk MASH (i.e., those with active disease and stage ≥2 fibrosis, but not cirrhosis). This shifts the rad’s role from descriptive to decisional. Identification now determines treatment eligibility.
The Quantitative Imaging Era: Eligibility criteria for Resmetirom were MRI-based, placing quantitative MR biomarkers at the center of clinical decision-making. This marks a broader transition: Radiology is moving from qualitative pattern recognition to measurable disease phenotyping.While MRI has led this evolution, ultrasound-based quantitative biomarkers are expected to follow, expanding access and scalability in the near term. Recently, Dr. Sirlin and Scott B. Reeder, MD, emphasized this shift in an editorial introducing rads to the expanding role of quantitative MRI biomarkers in metabolic liver disease.
Pattern → Risk → Responsibility: MASLD progresses from fat accumulation to inflammation and fibrosis. → Patients with MASH plus stage ≥2 fibrosis face liver-related outcomes and are candidates for therapy. → Rads must accurately stage fibrosis and quantify disease to guide referral and treatment.
Clinical Takeaway: The most important insight is conceptual . . . At-risk MASH is a fibrosis-driven definition, not a fat-driven one.
Quantitative imaging, particularly MR-based biomarkers, now determines:
Who gets referred
Who receives therapy
Who remains under surveillance
This is not simply a nomenclature update. It is a reimbursement, therapeutic, and prognostic pivot point for abdominal imaging.
Bottom Line: In the era of approved therapy, identifying at-risk MASH is no longer optional precision; it is actionable medicine.
When a pediatric patient presents with back pain, MRI of the spine is a powerful tool to distinguish between benign and malignant processes. In this case of a 7-year-old girl from a Quick Byte presentation by Laura M. Fayad, MD, the imaging reveals systemic replacement of the normal bone marrow.
Primary Observations
Darkness: On T1-weighted imaging, the marrow signal is abnormally dark.
Vertebral Compression: Multiple areas of the spine show vertebral body height loss and fractures.
Diagnostic Worry: Indeed, this combination of diffuse signal abnormality and pathologic fractures is highly concerning for leukemia.
Dixon for Clarification: To confirm if the marrow has been replaced by tumor, a variation of the in-and-out-of-phase gradient echo, the Dixon technique, can be used. Dixon provides fat-only and water-only images to isolate specific tissues.
Fat-Only Imaging: In a normal patient, fat should be visible within the marrow.
The Dropout Test: In this patient, while fat is clearly visible in the subcutaneous and epidural spaces, there is a complete absence of fat signal within the bone marrow.
Conclusion: The total lack of marrow fat indicates that the space has been entirely replaced by malignant cells.
Fat Fraction Analysis: Beyond visual inspection, we can measure the MRI fat fraction to provide an objective data point.
10% Rule: In pediatric patients, a fat fraction of less than 10% is a significant indicator of malignant bone marrow.
Comparison: Normal control marrow typically maintains a much higher fat fraction, often ranging from 20% to over 50%.
Marrow Category
MRI Fat Fraction (%)
Clinical Significance
Malignant
< 10%
Highly concerning for leukemia or tumor infiltration.
The Problem: Traditional CTA is a structural map. It tells you there is a fallen tree on the road (i.e., the clot), but it doesn’t always tell you if the traffic has stopped (i.e., the perfusion). In subsegmental disease or “dirty” scans with beam-hardening artifacts, structural-only imaging leaves radiologists in the equivocal trap.
The Fix? As the ARRS Online Course “Practical Dual-Energy CT Throughout the Body” points out, by pairing iodine quantification with anatomical imaging, rads can move from searching for filling defects to visualizing physiologic impact.
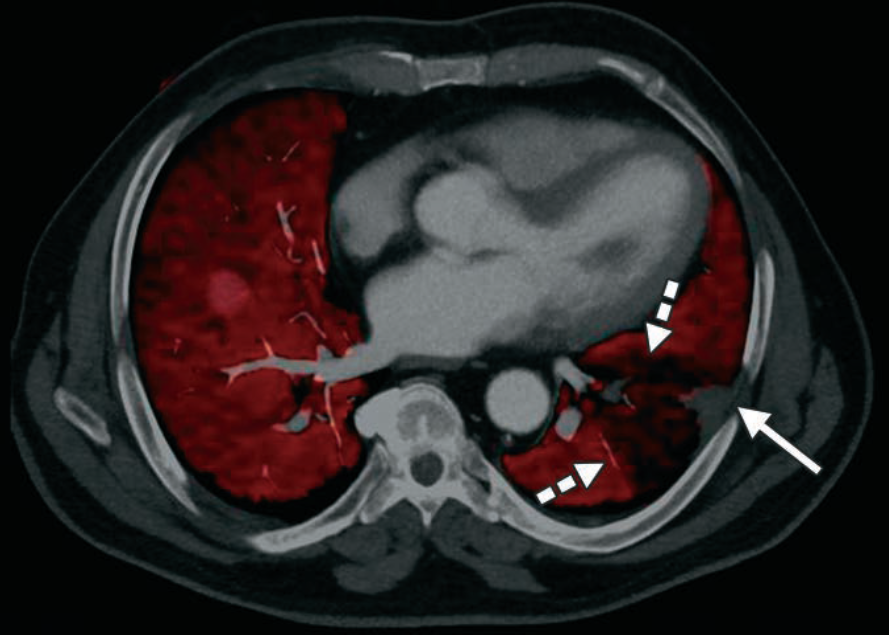
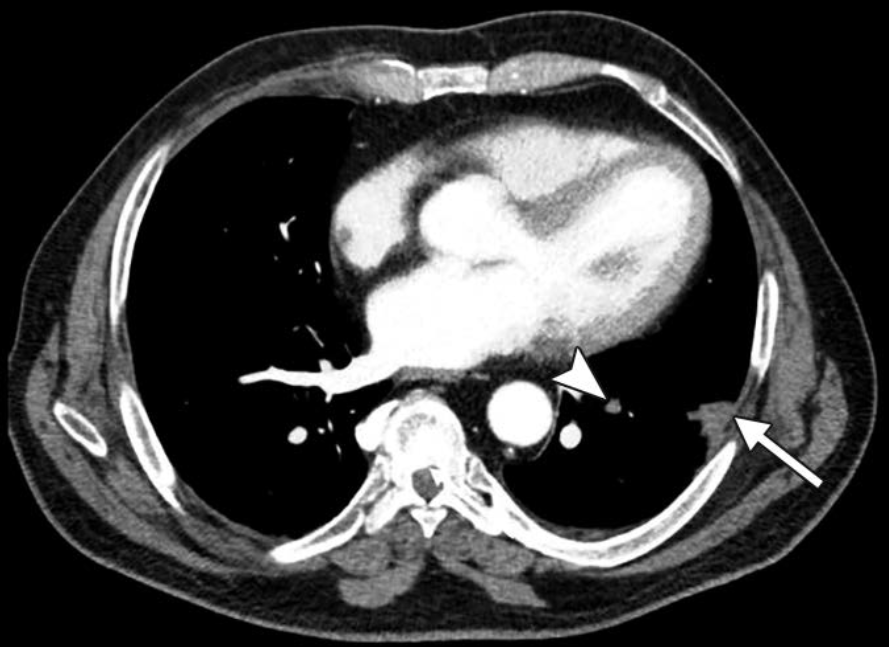
The Breakdown—A multi-vector look at a left subsegmental PE...
Standard Blended—We see the “What.” A classic peripheral wedge-shaped opacity: Hampton Hump (solid arrow). There is a subtle luminal filling defect in the feeding vessel (arrowhead), but in a motion-degraded scan, you might doubt it.
Iodine Map—We see the “So What.” The red overlay represents iodine concentration. The dashed arrows highlight a perfusion “cold zone.” This wedge-shaped defect provides orthogonal confirmation that the clot isn’t just an artifact; it’s a functional obstruction.
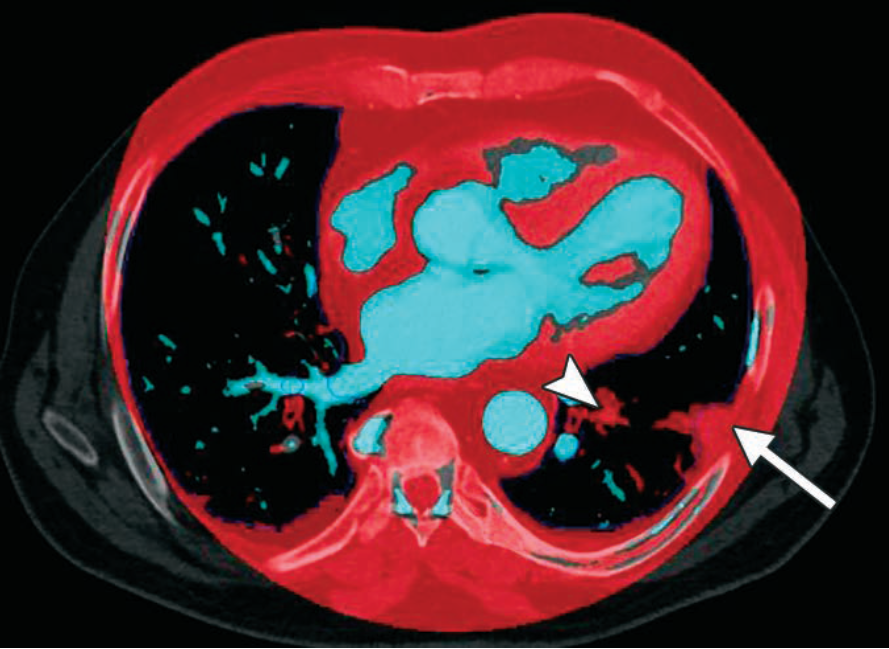
Vessel Analysis—This reconstruction isolates iodine signal. Note the iodine dropout (arrowhead) within the artery. This removes the noise of the lung parenchyma to focus strictly on the continuity of the blood column.
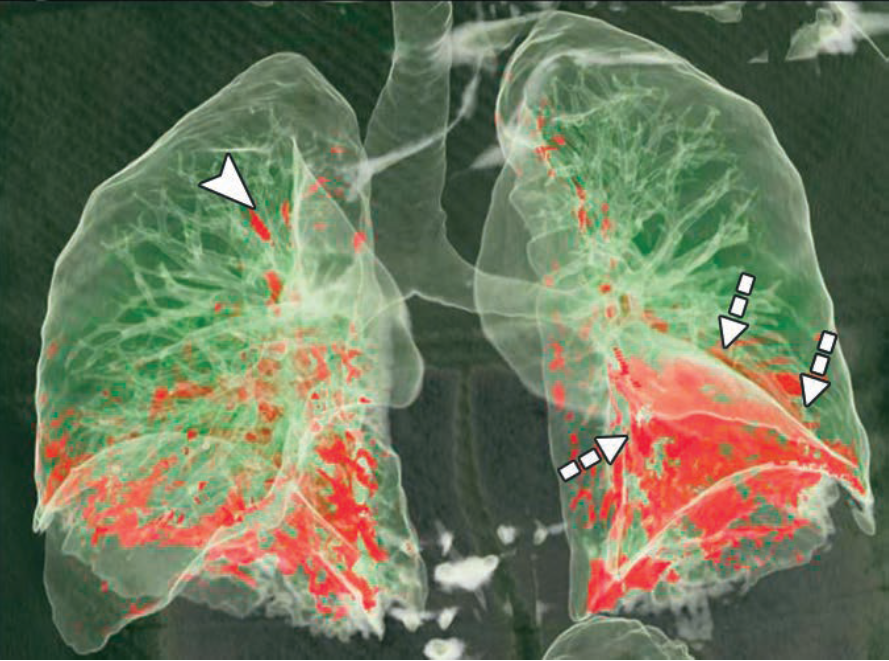
3D Perfusion—The “Global Impact.” This 3D volume rendering maps the total territory of the ischemic lung (red zones). It’s the visual shorthand for clinical severity.
Push for DECT in Your PE Protocol?
Tie-Breaker: Small distal clots are often equivocal. If you see a corresponding wedge-shaped perfusion defect on the iodine map, your confidence in calling a subsegmental PE jumps from “possible” to “definitive.”
Artifact Insurance: Beam hardening from dense contrast in the SVC often obscures the right upper lobe. DECT iodine maps help differentiate true clots from “pseudo-filling defects” caused by photon starvation.
Infarct Prediction: A Hampton Hump is a late sign of infarction. DECT identifies the ischemic penumbra (the area at risk) before it potentially progresses to permanent tissue death.
Bottom Line: DECT transforms PE imaging from a binary search (clot vs. no Clot) into a physiologic assessment (obstruction + ischemia). Result? Fewer “equivocal” reports and higher diagnostic defensibility.