Radiology education has evolved significantly over the last decade, particularly with respect to the medium in which content is delivered to learners. As a trainee nearly a decade ago, I relied heavily on printed books, peer-reviewed journal articles, and, occasionally, online resources for learning the fundamentals of diagnostic radiology and preparing for board examinations. In their own quest to learn the nuances of radiology, the current generation of radiology learners—medical students, residents, and fellows—are turning more frequently to open-access sources widely available on the internet .
Musculoskeletal Radiology Case Discussions
In an effort to engage this millennial generation of learners, I decided to deliver and publish educational videos on YouTube. While there is a plethora of expertly curated content online—ARRS’ own monthly newsletter, The Resident Roentgen File, chief among them—I wanted to provide a service specific for radiology trainees and medical students interested in diagnostic radiology.
To that end, each week, I publish brief musculoskeletal case discussions on high-yield topics that are geared to prepare junior and senior radiology residents for the American Board of Radiology (ABR) Core Exam. These videos are helpful for radiology residents and medical students alike—anyone wishing to learn more about the fundamentals of commonly encountered musculoskeletal pathologies and diagnoses seen in the reading room on a day-to-day basis.
ARRS #FOAMrad: Joints of the Lower Extremities
Meanwhile, this open-access ARRS Web Lecture series, Musculoskeletal Lower Extremity Joints, considers MR features and diagnosis relating to foot, ankle, and hindfoot pain; commonly missed injuries in lower extremity joints; and patterns of injuries seen on knee MRI.
United States Medical Licensing Examination Tutorials
Recently, for medical students, I started publishing short YouTube tutorials every week with tips for succeeding on the United States Medical Licensing Examination (USMLE) through the lens of imaging. Every year, I hear more and more medical students telling me that more imaging appears on the USMLE examination, and students often feel unprepared for interpreting complex images during the examination.
Thus, I decided to offer students free access to short tutorials regarding high-yield topics covered on the USMLE examination, focused on interpreting diagnoses and pathologies they are likely to encounter. As a secondary aim, I hope these videos will show medical students throughout the world the importance radiology plays in the delivery of optimal patient care.
ARRS #FOAMrad: ABR Exam Prep
As the landmark assessment for in-training radiologists, there are myriad materials of varying utility to prepare them for the ABR Qualifying (Core) Exam. Featuring practical tips from residents who have recently aced the test, this ARRS Roentgen University webinar is purposefully designed to help future test-takers of all learning types identify the most useful, truly indispensable study guides.
The landscape and education of radiology is changing; we must embrace this opportunity to provide our students and trainees the most relevant content in a way that is most feasible for their learning. I hope that radiology educators will continue to use the most pertinent innovative tools and methods to educate the new generation of learners. Our field depends upon it.
Department of Radiology and Biomedical Imaging University of California, San Francisco
Brett M. Elicker
Department of Radiology and Biomedical Imaging University of California, San Francisco
The diagnosis of interstitial lung disease (ILD) involves multidisciplinary collaboration among radiology, pulmonary medicine, rheumatology, and anatomic pathology disciplines. Imaging findings play a major role in the diagnosis of a variety of diffuse lung diseases, and the radiologist’s input into the ultimate diagnosis is often substantial [1]. Imaging is of critical importance in the diagnosis of ILD, although the accurate interpretation of characteristic high-resolution CT (HRCT) findings can be challenging. This InPractice article will review common pitfalls for those tasked with interpretation of CT in the diagnosis of ILD with a focus on avoiding common errors, identifying distinguishing features of specific diagnoses, and recognizing entities with which CT has limited sensitivity.
Overdiagnosis of Usual Interstitial Pneumonia Pattern
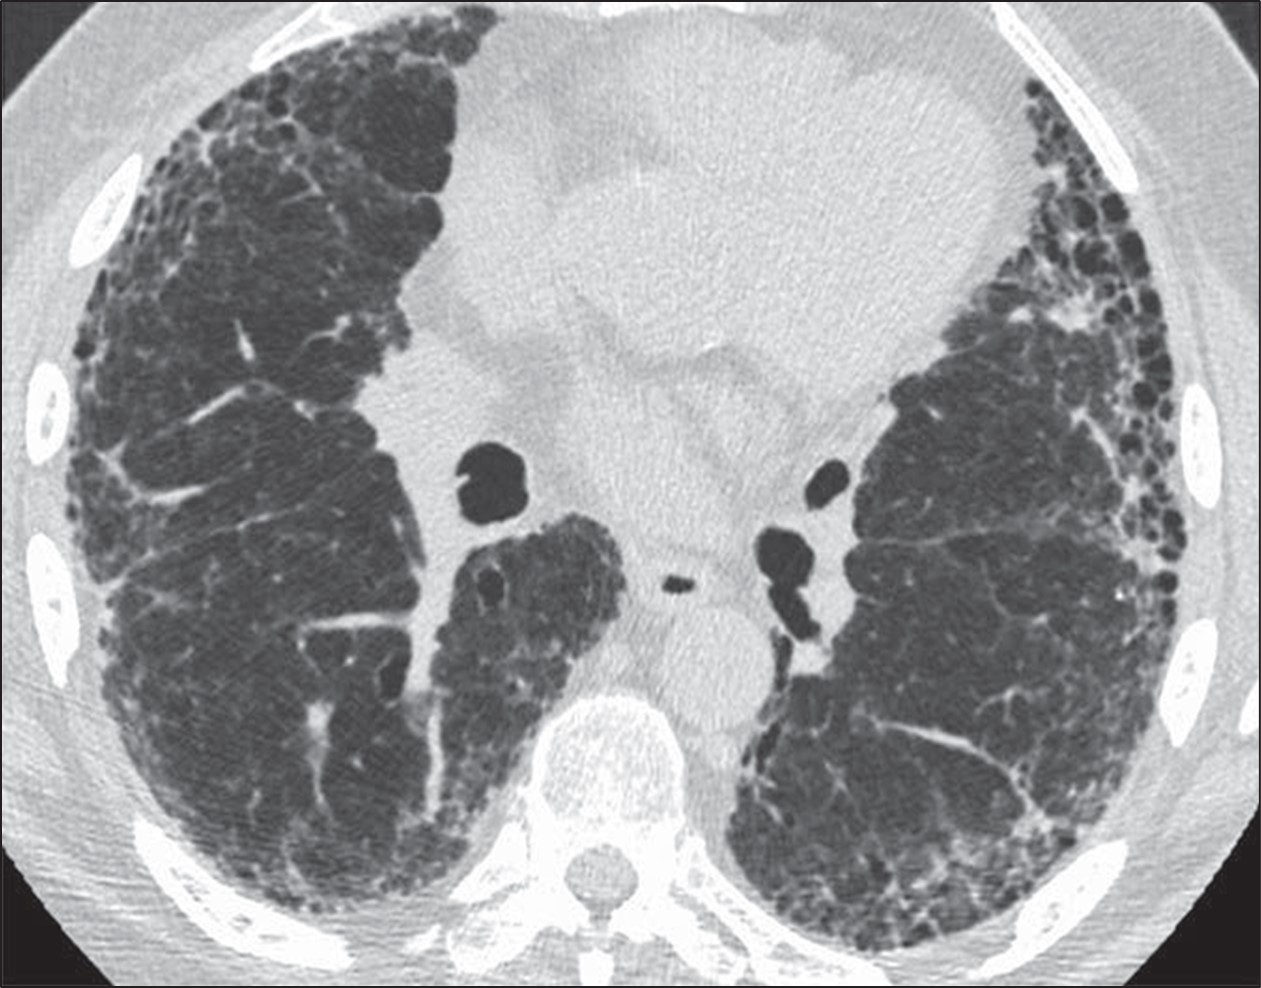
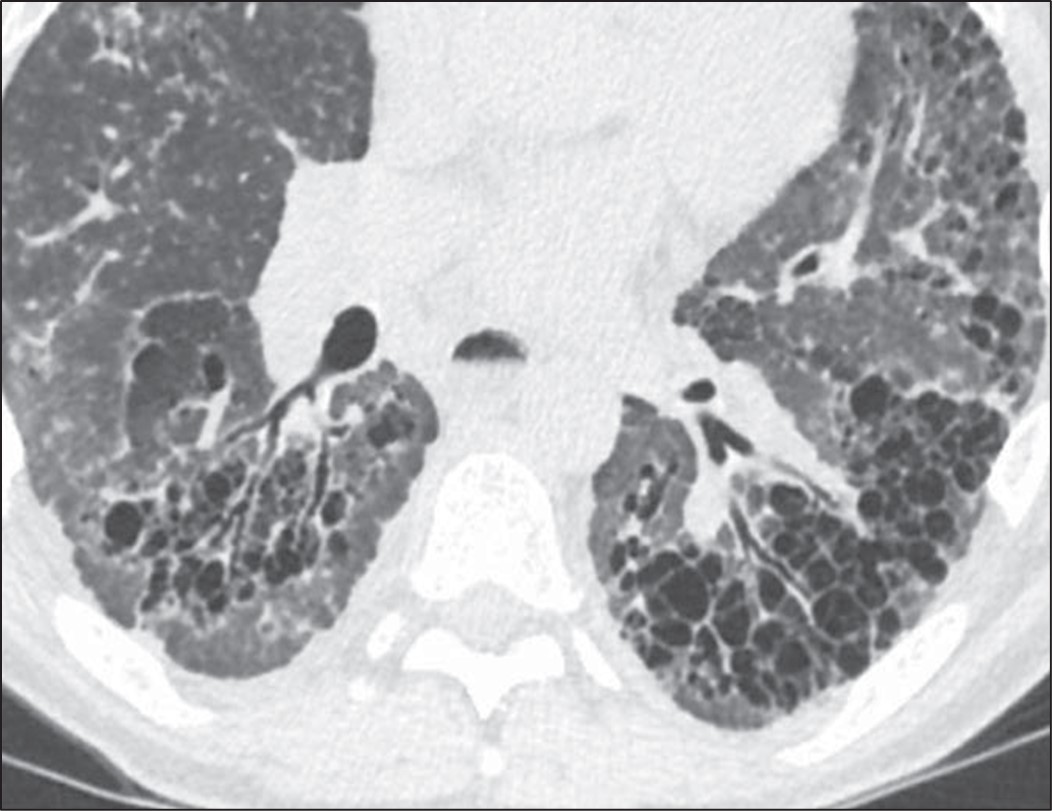
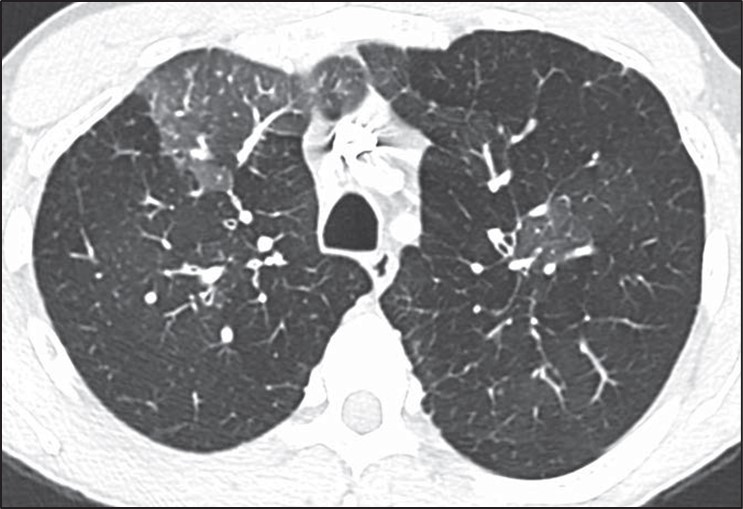
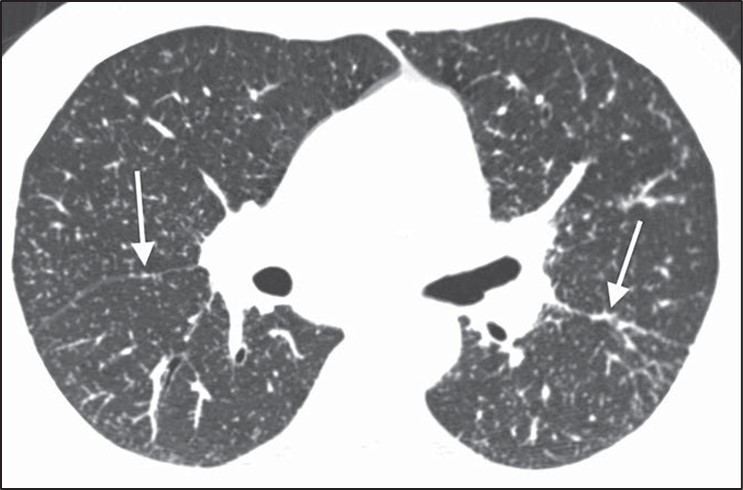
The goals of the radiologist in the evaluation of a patient with suspected pulmonary fibrosis are to determine whether a diffuse lung disease is present, determine the pattern of fibrosis, and provide an appropriate differential diagnosis. Usual interstitial pneumonia (UIP) pattern of pulmonary fibrosis is the most common ILD. UIP is most frequently idiopathic, but can also be secondary to connective tissue disease, medications, or exposure to asbestos [2]. Given the pervasiveness of this diagnosis, radiologists participating in the multidisciplinary diagnosis of patients with suspected ILD are frequently asked whether CT findings support a UIP diagnosis.Fortunately, guidelines can increase the confidence of radiologists in correctly identifying patients with UIP. The American Thoracic Society guidelines for the diagnosis of UIP pattern break down CT findings into four categories: UIP, probable UIP, indeterminate for UIP, and alternative diagnosis. The CT findings indicative of UIP pattern include subpleural and basal predominant fibrosis in addition to honeycombing, with or without traction bronchiectasis (Fig. 1).
Fig. 1—73-year-old man with idiopathic pulmonary fibrosis. HRCT scan shows usual interstitial pneumonia pattern of fibrosis characterized by subpleural and basal distribution of fibrosis with honeycombing.
This is to be distinguished from the probable UIP pattern, which is characterized by the same distribution of fibrosis including reticulation and traction bronchiectasis, but the absence of honeycombing [3].
The PPV of UIP pattern on CT for histologic UIP at surgical lung biopsy exceeds 90%, and as such, surgical lung biopsy is rarely performed when a confident diagnosis of UIP pattern can be made from imaging [3, 4]. For this reason, a diagnosis of UIP should only be made when the radiologist is confident that the imaging findings are consistent with this pattern, because often further diagnostic testing will not be pursued, potentially depriving the patient of the opportunity to receive the correct diagnosis. This distinction is not trivial; those diagnosed with UIP may be treated with antifibrotic medications and thus be subject to the side effects thereof. Not surprisingly, patients treated with antifibrotics for UIP will not be given immunosuppressive therapy, which could be a more appropriate treatment in the setting of another histologic diagnosis (e.g., nonspecific interstitial pneumonia) nor will an extensive search for exposures be pursued (e.g., as is done with patients with hypersensitivity pneumonitis).
Given the importance of correctly making a diagnosis of UIP and avoiding overdiagnosis of this entity, radiologists interpreting HRCT should be mindful of the potential pitfalls described in the following sections.
Correctly Distinguish Honeycombing From Mimics
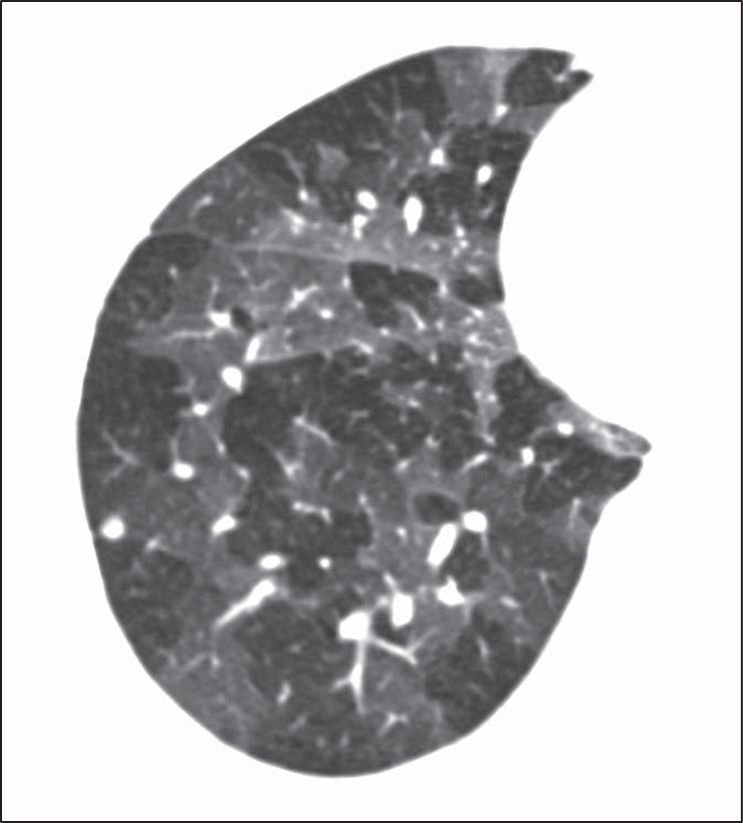
Honeycombing can be confidently diagnosed when there is a group of round clustered air-filled cysts in a row or cluster in the subpleural lung [5]. The subpleural involvement in honeycombing is critical in distinguishing it from other abnormalities. Multiple layers of cysts increase the reader’s confidence in honeycombing but are not required for diagnosis. Honeycomb cysts usually range in size from 3 to 10 mm and have relatively thick, well-defined walls [6]. In general, there is moderate agreement among radiologists for the presence of honeycombing, with kappa values ranging from 0.4 to 0.6 in one series comparing 43 different observers. There was disagreement on the presence of honeycombing in 29% of these cases [7]. Use of the above general rules for the features of honeycombing is helpful when distinguishing from common mimics. The most frequent findings mistaken for honeycombing include traction bronchiectasis, cystic lung disease, emphysema, and subpleural reticulation [8].To distinguish traction bronchiectasis from honeycombing, the shape of the air-filled structure should be noted. Airways in traction bronchiectasis are tubular in shape, which may be best seen on multiplanar reformatted images. Additionally, air-filled structures in the central or peribronchovascular lung are not consistent with honeycombing and are very likely a result of dilated airways (Fig. 2).
Fig. 2—Patient with scleroderma and fibrotic nonspecific interstitial pneumonia. Left, HRCT scan shows traction bronchiectasis mimicking honeycombing. Right, HRCT scan shows that air-filled structures spare subpleural lung.
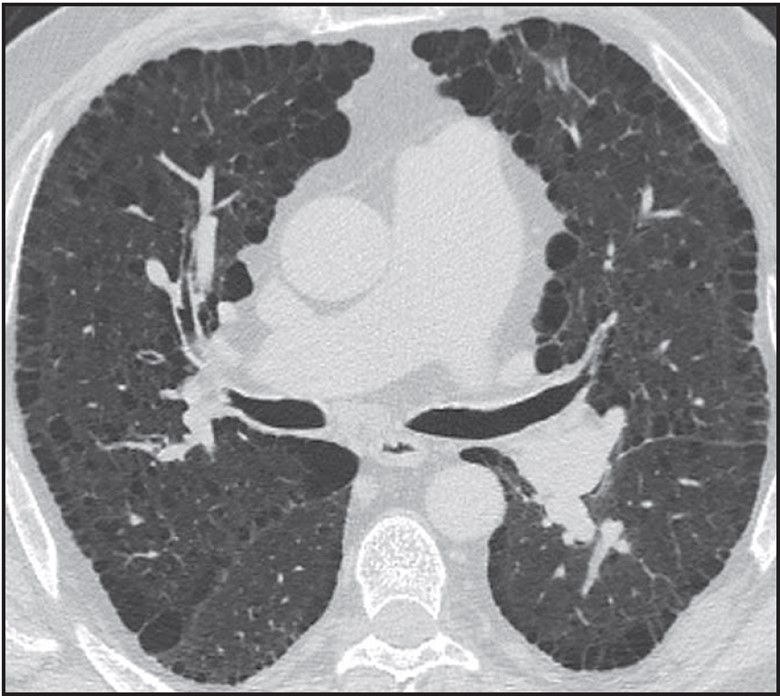
Destruction of airspaces in patients with emphysema can lead to the presence of air-filled structures in the subpleural lung; however, these structures can be distinguished from honeycombing by the overall size of emphysematous spaces that in general are larger than honeycombing cysts, the presence of paper-thin walls in emphysema in contrast to thicker walls of honeycombing, and the absence of other findings of fibrosis such as reticulation and traction bronchiectasis in patients with emphysema [9] (Fig. 3).
Fig. 3—HRCT scan shows patient with paraseptal emphysema with extensive involvement of subpleural lung, but without well-defined walls or other findings of fibrosis.
Cystic lung disease can be distinguished from honeycombing given that the cysts are often larger, scattered throughout the lung rather than clustered, and not subpleural in distribution. Shape can also be helpful in distinguishing cystic lung disease from honeycombing in that honeycomb cysts are round, whereas several cystic lung diseases are characterized by either oblong or elliptical cysts (Birt-Hogg-Dubé syndrome) or irregularly shaped cysts (Langerhans cell histiocytosis) [10].
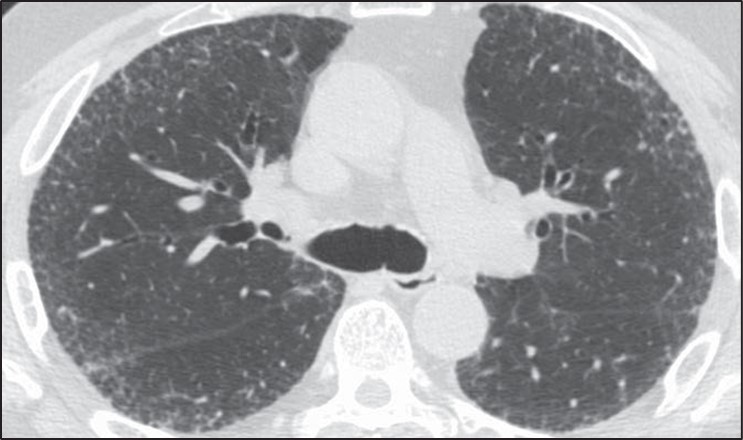
Reticulation or fine lines in the subpleural lung can also be mistakenly identified as honeycombing. To avoid this pitfall, radiologists should ensure that the subpleural abnormality is air density rather than lung density (Fig. 4).
Fig. 4—HRCT scan shows thin lines in subpleural lung in patient with pulmonary fibrosis characterized by diffuse reticulation. Abnormality in subpleural lung is lung density (same as more central lung parenchyma) rather than air density (for example in trachea), which is helpful in confirming that these findings do not represent honeycombing.
Identify Whether the Distribution of Fibrosis Is Subpleural and Basal
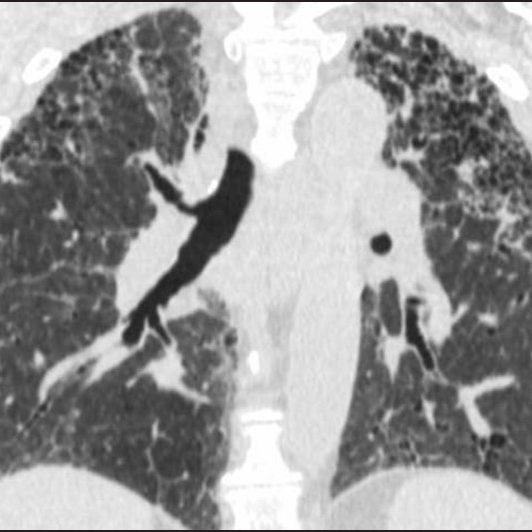
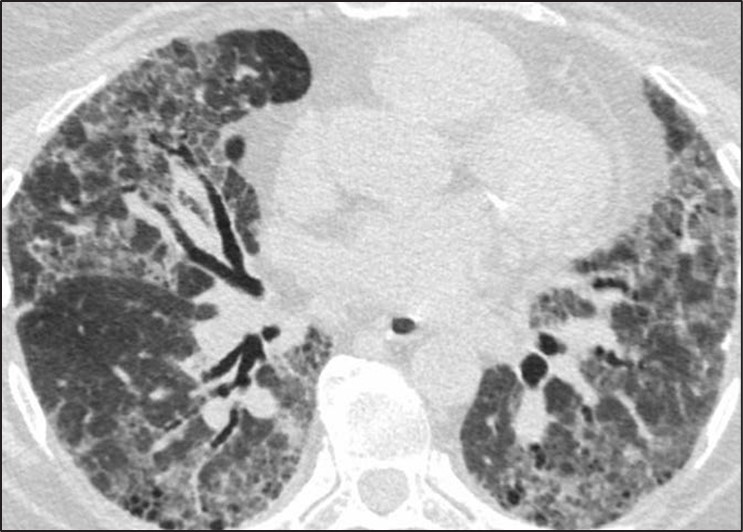
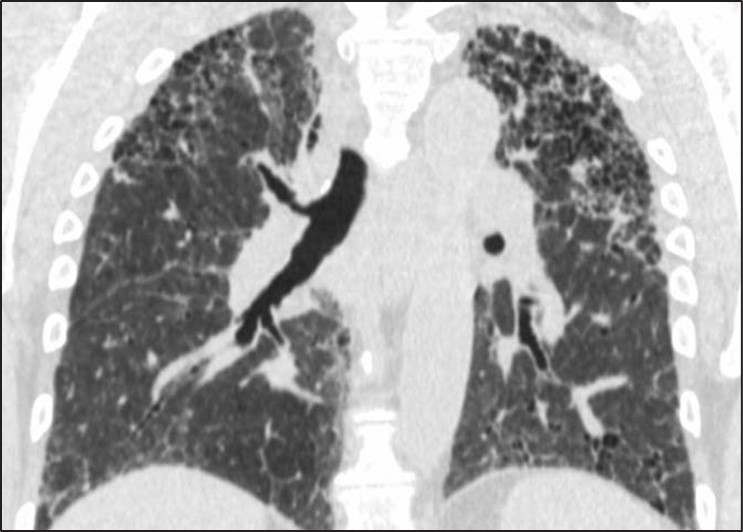
Fig. 5—Fibrosis with honeycombing in atypical distribution. Left, Axial HRCT scan shows diffuse fibrosis in association with ground-glass opacity. Diagnosis was hypersensitivity pneumonitis. Right, Coronal HRCT scan shows upper lobe–predominant fibrosis. Diagnosis was sarcoidosis.
Fibrosis that is diffuse in the axial plane or predominately in an upper lung, central, or peribronchovascular distribution may indeed be associated with honeycombing but nonetheless be caused by other entities such as nonspecific interstitial pneumonia, sarcoidosis, or hypersensitivity pneumonitis [11, 12]. Subpleural and basal distribution of fibrosis is essential to describing a pattern of fibrosis consistent with UIP at imaging. A percentage of cases with atypical distributions of fibrosis and honeycombing may be subsequently identified as UIP after biopsy; however, these cases are exactly those that benefit from surgical lung biopsy because there is a relatively high chance (70%) that another diagnosis will be found [12, 13].
Identify Inconsistent Findings
Numerous CT findings are of a diagnosis other than UIP pattern including the presence of significant ground-glass opacity, marked mosaic attenuation, nodules, and consolidation [13]. Each of these findings points the radiologist toward a diagnosis other than UIP. Patients with nonspecific interstitial pneumonia (i.e., ground-glass opacities), hypersensitivity pneumonitis (i.e., mosaic attenuation), sarcoidosis (i.e., nodules), and organizing pneumonia (i.e., consolidation) can all be identified by the presence of these features, and the presence of honeycombing should not detract from the CT findings that indicate these alternative diagnoses.
Overdiagnosis of Cystic Lung Disease
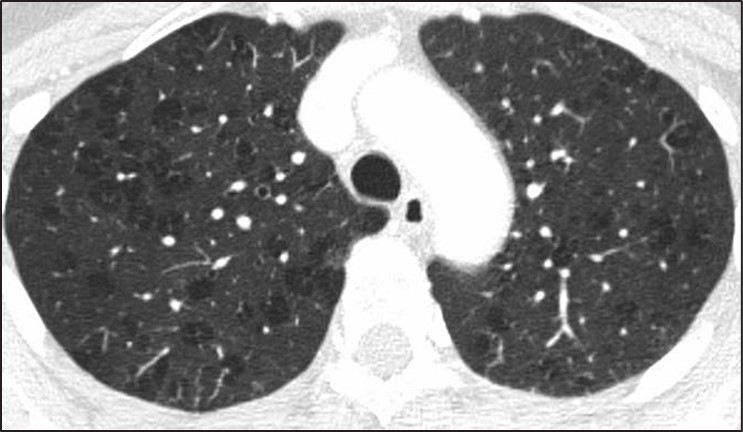
Many of the pitfalls in correctly identifying honeycombing and distinguishing honeycombing from mimics can also be applied to the correct diagnosis of cystic lung disease. When considering a potential diagnosis of cystic lung disease, it is important to again identify mimics: honeycombing, dilated airways and bronchiectasis, and emphysema. The extent of abnormality, from mild to severe, is also important to consider in this context. A few scattered pulmonary cysts may be considered in the spectrum of normal, particularly for older patients, and are most likely postinfectious rather than indicative of a cystic lung disease [14].Whereas the primary features of bronchiectasis (i.e., tubular shape) and honey- combing (i.e., thick walls, clustered, subpleural) make distinguishing these entities from cystic lung disease more straightforward, correctly distinguishing cystic lung disease from emphysema can be challenging. This challenge is in part because both entities can have very thin or imperceptible walls and can occur on a spectrum from mild to severe. The presence of the “central dot” sign in which the centrilobular artery is seen within an emphysematous space can be helpful in correctly distinguishing centrilobular emphysema from a cystic lung disease; however, this finding is not reliably seen in all regions of emphysema [15] (Fig. 6).
Fig. 6—Axial HRCT scan shows “central dot” sign in patient with centrilobular emphysema.
In general, pulmonary cysts are fewer in number, noncentrilobular in distribution, and have thicker or more perceptible walls compared with centrilobular emphysema [16]. Paraseptal emphysema and panlobular emphysema are less frequently mistaken for cystic lung disease because of their strongly subpleural distribution and overall extent respectively.
Distinguishing cystic lung diseases from one another can also be challenging; however, several key features including cyst shape, number, distribution, and classic demographic factors and associated findings can aid the radiologist in providing an appropriate differential diagnosis. Using these features allows the radiologist to narrow the differential diagnosis for a particular case to fit the specific CT features seen rather than including a long differential diagnosis consisting of all cystic lung diseases [17]:
Female sex, renal angiomyolipoma Pneumothorax, renal mass Cysts and nodules Smoker Ground-glass opacity, connective tissue disease
The presence of associated features may also be helpful in correctly identifying the presence and cause of a cystic lung disease when the abnormalities are mild and nonspecific.
Pitfalls in the Interpretation of Mosaic Attenuation and Small Airways Disease
Small airways disease may present a significant challenge in HRCT interpretation and typically manifests on HRCT as two main categories of findings: nodules or mosaic attenuation. Nodules may correspond to any of the following histologic findings: inflammation within the lumen of the airways, alveolar disease centered on the airway, or peribronchiolar interstitial inflammation. Diseases categorized by nodules are generally detected on HRCT with high sensitivity and are typically straightforward to classify.
Small airways obstruction causes hypoxia distal to the area of obstruction, resulting in regional areas of reflex vasoconstriction. Given that approximately 50% of lung attenuation is due to blood flow, regional reductions in perfusion result in a decrease in lung attenuation. These regional areas of decreased lung attenuation are described as “mosaic attenuation” or “mosaic perfusion.” More precisely, mosaic attenuation is a more general term and describes the presence of geographic areas of different lung attenuation but does not make a determination as to which lung is abnormal, whether the opaque or lucent lung. Mosaic perfusion, on the other hand, implies specifically that the lucent lung is abnormal and is the finding that most precisely corresponds to airways obstruction with reflex vasoconstriction [18].
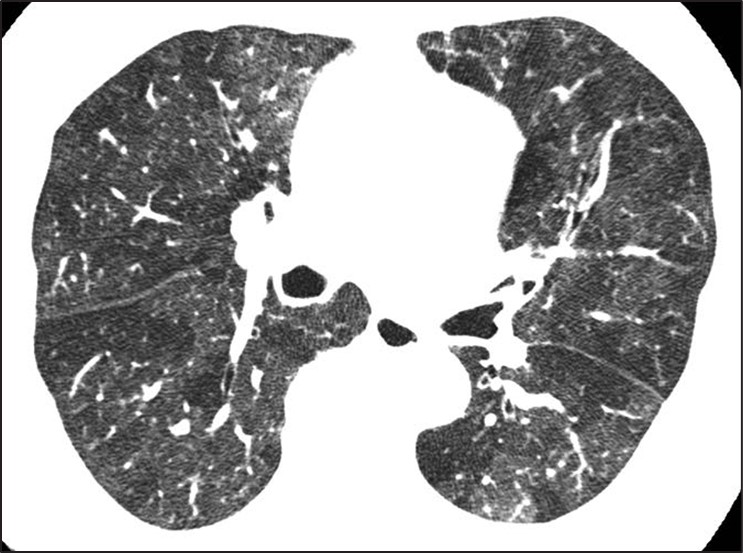
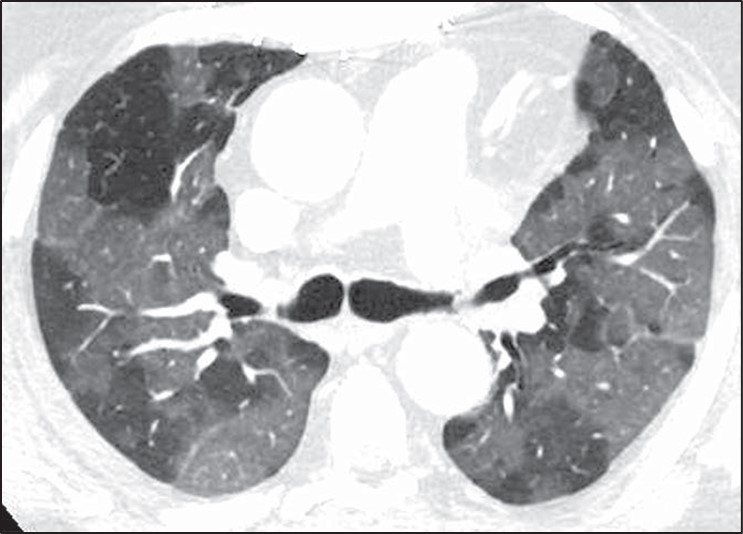
The differential diagnosis of mosaic perfusion is broad and encompasses a wide variety of both small airways diseases and pulmonary vascular diseases. It may be associated with other findings (e.g., nodules) or may be seen in isolation. The presence of mosaic perfusion is most helpful in formulating a differential diagnosis when seen in isolation, in which case it may be due to pulmonary vascular disease (mainly chronic thromboembolic disease), constrictive bronchiolitis, asthma, and hypersensitivity pneumonitis [19].Diseases characterized by isolated mosaic perfusion may present a significant challenge for several reasons. First, mosaic perfusion is a finding that is sometimes difficult to detect on HRCT. The subtle difference in attenuation frequently seen between the normal and more lucent lung is better observed when a narrow window is applied to the HRCT examination, accentuating the attenuation differences (Fig. 7).
Fig. 7—Mosaic perfusion and importance of windowing in high-resolution CT (HRCT). Left, Standard lung window in HRCT shows heterogeneous lung attenuation with subtle difference between opaque and lucent lung. Right, More narrow window accentuates difference between two lung attenuations and increases sensitivity for detection of mosaic perfusion.
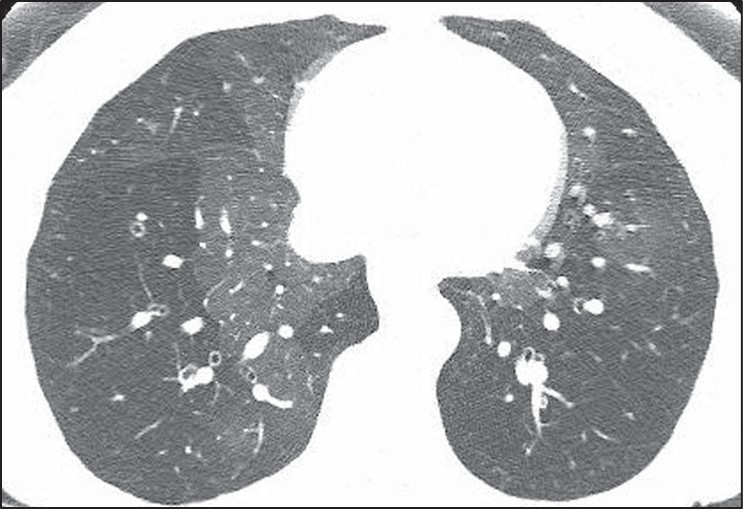
Second, when small airways or vascular diseases are diffuse in nature they result in a global and uniform decrease in lung perfusion. A diffuse HRCT abnormality is difficult to identify because there is no normal lung with which to compare the abnormality. This is most commonly seen in severe constrictive bronchiolitis [20]. Additionally, diffuse air trapping on expiratory CT is difficult to distinguish from poor timing or an inadequate respiratory effort. In these cases the HRCT scan may appear normal despite profound dyspnea and marked obstruction on pulmonary function tests. The diffuse but subtle decrease in lung attenuation is often not detected given its homogeneous nature.Mosaic perfusion (i.e., abnormal lucent lung) should be distinguished from ground-glass opacity (i.e., abnormal opaque lung), however, this distinction also has several pitfalls. Features that favor mosaic perfusion include sharp borders between the two regions of lung, smaller vessels in the lucent lung, and air trapping on expiration in the areas that were lucent on inspiration that only present in small airways disease (Fig. 8).
Fig. 8—Features of mosaic perfusion on high-resolution CT (HRCT). First two images, Axial HRCT scans show typical features of mosaic perfusion including sharp borders between opaque and lucent lung (first), larger vessels in normal more opaque lung (second), and air trapping on dynamic expiratory images. Third and fourth image, Paired inspiratory (third) and expiratory (fourth) HRCT images show heterogeneous lung attenuation on inspiration and air trapping on expiration.
None of these features are perfect in making this distinction, however. For instance, diseases characterized by ground-glass opacity may occasionally be geographic with sharp borders (Fig. 9).
Fig. 9—Axial high-resolution CT scan shows ground-glass opacity due to SARS-CoV-2 infection. Sharp borders between areas of opaque and lucent lung usually suggest that lucent lung is abnormal and pattern is mosaic perfusion. However, sharp borders may occasionally be seen in ground-glass opacity, such as in this case. Normal lung and areas of ground-glass opacity show marked difference in attenuation.
In these cases, the absolute difference in attenuation between the two regions of lung may be helpful. Mosaic perfusion typically results in a relatively subtle difference in attenuation between the diseased lucent lung and the normal opaque lung. Ground-glass opacity, on the other hand, typically shows a more marked difference in density between the two areas [21]. That being said, when mosaic perfusion results in significant shunting of blood away from the diseased areas, a greater difference in lung attenuation may be present. These cases are not infrequently misinterpreted as ground-glass opacity. Another challenge in the distinction between mosaic perfusion and ground-glass opacity is that many cases of mosaic perfusion will not show a significant difference in vessel size between the lucent and opaque lung. Last, pulmonary vascular diseases characterized by mosaic perfusion will not show air trapping on expiratory CT. Thus, expiratory CT is not helpful in the diagnosis of diseases such as chronic pulmonary embolism [22].
Pitfalls in the Interpretation of Diffuse Nodular Lung Disease
Formulating a differential diagnosis of diffuse nodular lung disease is done by identifying the distribution of nodules in relation to the pulmonary lobular anatomy. Three distributions have been described: perilymphatic, random, and centrilobular [23–25]. The perilymphatic distribution is characterized by patchy, clustered nodules that are concentrated most frequently in the peribronchovascular and subpleural interstitium. Random nodules will also be seen in the subpleural lung; however, they are not clustered but instead show diffuse homogeneous lung involvement. Centrilobular nodules are characterized by a distinct lack of nodules involving the subpleural interstitium.
The determination of the predominant pattern of diffuse nodular lung disease has several pitfalls. The perilymphatic pattern shows significant heterogeneity in the distribution of nodules. Although peribronchovascular and subpleural nodules are most typical, nodules in the interlobular septa, which also contain lymphatics, may predominate [26]. These cases may be confused for lymphangitic spread of tumor or pulmonary edema, although the thickening of the interlobular septa in pulmonary edema should be smooth, not nodular. The centrilobular interstitium is continuous with the peribronchovascular interstitium. Rarely, lymphatic diseases may have a predominance of centrilobular nodules overlapping with the centrilobular distribution (Fig. 10).
Fig. 10—Axial high-resolution CT scan shows centrilobular nodules in perilymphatic disease. Many centrilobular nodules (arrows) are present in this patient with sarcoidosis. Subpleural nodules reflect perilymphatic distribution of disease.
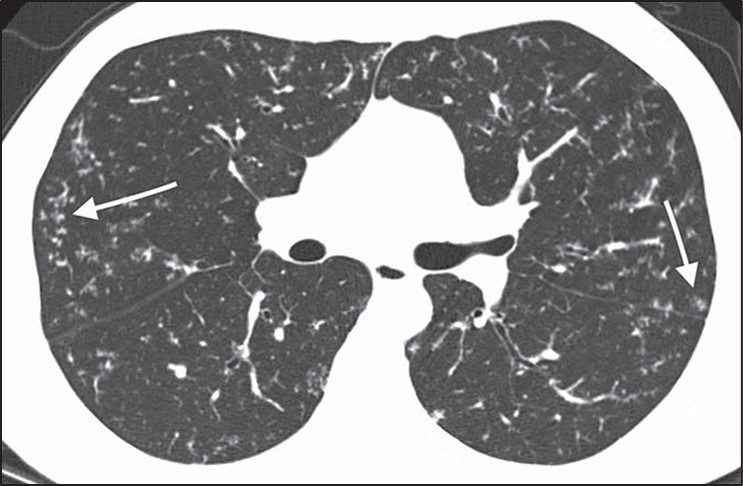
Although many centrilobular nodules may be present in lymphatic diseases, nodules should also be seen in the peribronchovascular or sub- pleural interstitium. This is in distinction to the centrilobular pattern in which only centrilobular nodules are present and no subpleural nodules should be seen. Lastly, diseases typically associated with a perilymphatic distribution of nodules (such as sarcoidosis) may occasionally show a fairly homogeneous involvement of the lung, mimicking a random distribution [27] (Fig. 11).
Fig. 11—Axial high-resolution CT scan shows perilymphatic distribution mimicking random nodules. Innumerable tiny nodules are present. Although pattern resembles random distribution, heterogeneous distribution in lung shows proportionally more nodules along fissures (arrows) than would be expected for random distribution.
A greater number of nodules in the subpleural or peribronchovascular interstitium may be the only clue that the distribution is perilymphatic.
Diseases for Which HRCT Has Limited Sensitivity
Certain categories of diseases may present with significant symptoms or pulmonary function test abnormalities but only manifest with mild HRCT abnormalities. Understanding the subtle imaging clues that may be present in these diseases is important in increasing the sensitivity of imaging for diagnosis. The two main categories of disease that show this discrepancy between symptoms and pulmonary function tests and HRCT manifestations of disease include small airways diseases and pulmonary vascular diseases. As discussed above, small airways diseases that manifest as isolated mosaic perfusion (e.g., constrictive bronchiolitis) may be difficult to detect on HRCT. The subtle increase in lung lucency associated with these diseases may be difficult to see, especially when the disease is diffuse in distribution [28]. Pulmonary vascular diseases such as pulmonary hypertension or chronic pulmonary embolism may also present with subtle findings. Centrilobular nodules or ground-glass attenuation or mosaic perfusion are often the only findings present and are typically much less severe than would be predicted by the patient’s advanced clinical symptoms. The lungs may appear completely normal in some patients with pulmonary vascular disease, in which case the only manifestation of pulmonary vascular disease may be extrapulmonary findings such as an enlarged pulmonary artery or right ventricular enlargement [29]. Lastly, pulmonary symptoms and pulmonary function test abnormalities might have one of several nonlung causes including pleural fibrosis, diaphragmatic dysfunction, and musculoskeletal abnormalities. All of these should be evaluated in patients with significant symptoms but no evidence of lung abnormalities on HRCT.
Awareness of common pitfalls in the diagnosis of ILD including the UIP pattern of fibrosis, cystic lung disease, airways disease, diffuse nodular disease, and lung diseases with subtle HRCT findings will better equip the radiologist to contribute to the multidisciplinary diagnosis of patients with ILD.
References
Hovinga M, Sprengers R, Kauczor HU, Schaefer-Prokop C. CT imaging of interstitial lung diseases. In: Schoepf UJ, Meinel FG, eds. Multidetector-row CT of the thorax. Springer, 2016:105–130
Wuyts WA, Cavazza A, Rossi G, Bonella F, Sverzellati N, Spagnolo P. Differential diagnosis of usual interstitial pneumonia: when is it truly idiopathic? Eur Respir Rev 2014; 23:308–319
Raghu G, Remy-Jardin M, Richeldi L, et al. Idiopathic pulmonary fibrosis (an update) and progressive pulmonary fibrosis in adults: an official ATS/ERS/ JRS/ALAT clinical practice guideline. Am J Respir Crit Care Med 2022; 205:e18–e47
Brownell R, Moua T, Henry TS, et al. The use of pre- test probability increases the value of high-resolution CT in diagnosing usual interstitial pneumonia. Thorax 2017; 72:424–429
Hobbs S, Chung JH, Leb J, Kaproth-Joslin K, Lynch DA. Practical imaging interpretation in patients suspected of having idiopathic pulmonary fibrosis: official recommendations from the Radiology Working Group of the Pulmonary Fibrosis Foundation. Radiol Cardiothorac Imaging 2021; 3:e200279
Hansell DM, Bankier AA, MacMahon H, McLoud TC, Müller NL, Remy J. Fleischner Society: glossary of terms for thoracic imaging. Radiology 2008; 246:697–722
Watadani T, Sakai F, Johkoh T, et al. Interobserver variability in the CT assessment of honeycombing in the lungs. Radiology 2013; 266:936–944
Arakawa H, Honma K. Honeycomb lung: history and current concepts. AJR 2011; 196:773–782
Devaraj A. Imaging: how to recognise idiopathic pulmonary fibrosis. Eur Respir Rev 2014; 23:215–219
Grant LA, Babar J, Griffin N. Cysts, cavities, and honeycombing in multisystem disorders: differential diagnosis and findings on thin-section CT. Clin Ra- diol 2009; 64:439–448
Abehsera M, Valeyre D, Grenier P, Jaillet H, Battesti JP, Braunerl MW. Sarcoidosis with pulmonary fibro- sis: CT patterns and correlation with pulmonary function. AJR 2000; 174:1751–1757
Silva CIS, Churg A, Müller NL. Hypersensitivity pneumonitis: spectrum of high-resolution CT and pathologic findings. AJR 2007; 188:334–344
Raghu G, Remy-Jardin M, Myers JL, et al. Diagnosis of idiopathic pulmonary fibrosis. an official ATS/ ERS/JRS/ALAT clinical practice guideline. Am J Respir Crit Care Med 2018; 198:e44–e68
Araki T, Nishino M, Gao W, et al. Pulmonary cysts identified on chest CT: are they part of aging change or of clinical significance? Thorax 2015; 70:1156–1162
Friedman PJ. Imaging studies in emphysema. Proc Am Thorac Soc 2008; 5:494–500
Lee KC, Kang EY, Yong HS, et al. A stepwise diagnostic approach to cystic lung diseases for radiologists. Korean J Radiol 2019; 20:1368–1380
Ferreira Francisco FA, Soares Souza A, Zanetti G, Marchiori E. Multiple cystic lung disease. Eur Respir Rev 2015; 24:552–564
Parambil JG, Yi ES, Ryu JH. Obstructive bronchiolar disease identified by CT in the non-transplant population: analysis of 29 consecutive cases. Respirology 2009; 14:443–448
Loverdos K, Fotiadis A, Kontogianni C, Iliopoulou M, Gaga M. Lung nodules: a comprehensive review on current approach and management. Ann Thorac Med 2019; 14:226–238
Gruden JF, Webb WR, Naidich DP, McGuinness G. Multinodular disease: anatomic localization at thin-section CT—multireader evaluation of a simple algorithm. Radiology 1999; 210:711–720
Shroff G, Konopka K, Chiles C. Perilymphatic pulmonary nodules: definition, differential diagnosis, and demonstration of the “pipe-cleaner” sign. Con- temporary Diagnostic Radiology 2013; 36:1–5
Rajagopala S, Sankari S, Kancherla R, Ramanathan RP, Balalakshmoji D. Miliary sarcoidosis: does it exist? A case series and systematic review of literature. Sarcoidosis Vasc Diffuse Lung Dis 2020; 37:53–65
Hansell DM. Small airways diseases: detection and insights with computed tomography. Eur Respir J 2001; 17:1294–1313
Kacprzak A, Burakowska B, Kurzyna M, et al. Predictive value of chest HRCT for survival in idiopathic pulmonary arterial hypertension. Respir Res 2021; 22:293
Center for Evidence-Based Imaging Brigham and Women’s Hospital
What would you do if your hospital was going to run out of iodinated contrast? Reduce the amount of IV contrast used for each CT scan? Administer multiple doses of IV contrast from a single-use vial? Defer non-urgent contrast-enhanced CT? Utilize alternative modalities, such as ultrasound, MRI, or PET/CT?
In March of last year, supply chain disruptions in China resulted in an unexpected 80% reduction in global supply of iohexol (Omnipaque, GE Healthcare). Hospitals needed to make immediate decisions about ways to conserve contrast. Otherwise, they may run out. The American College of Radiology [1], Radiological Society of North America [2], and American Hospital Association [3] released statements, and AJR continues to publish all of its research regarding the contrast media shortage as free and open access [4].
The situation was rapidly evolving, but getting more inventory wasn’t an option. As part of the response to the contrast shortage, our hospital system created and implemented an electronic health record (EHR) -based solution to help reduce iodinated contrast usage by targeting referring provider CT ordering patterns [5].
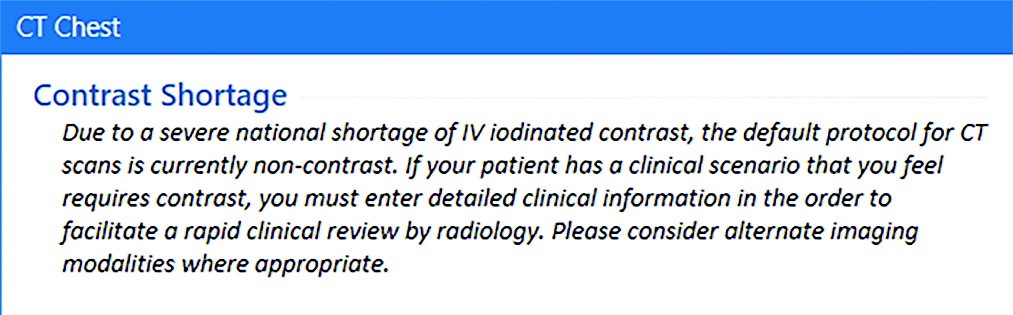
First, we added a sidebar to the ordering panel that presented an alert describing the shortage (Fig. 1), including the following strategies for imaging patients (Intervention 1; May 10, 2022):
Fig. 1—Screenshot from electronic health record shows sidebar text displayed to referring clinicians after placing orders for body CT (defined as CT of neck, chest, or abdomen and pelvis) that describes iohexol shortage and provides appropriate strategies for iodinated contrast media conservation.
Oncologic Imaging
Avoid contrast for chest CT done alone to assess metastatic disease, unless primary is thoracic malignancy
For chest/abdomen/pelvis restaging exams, consider combining non-contrast CT chest with abdominal MRI
Consider abdominal MRI for assessment of hepatic metastases
Non-Oncologic Imaging
CT for pulmonary embolism (PE)—utilize risk scoring methodology, such as Wells criteria or pulmonary embolism rule-out criteria (PERC), before pursuing CT
CT chest for lung parenchymal disease does not require IV contrast
In case of suspected musculoskeletal infection, use MRI
Emergency Imaging
Neuro
CTA head/neck—contrast needed to assess large vessel occlusion in patients within stroke treatment window. For subacute stroke outside window, please consider non-contrast head CT, followed by MRI, when appropriate
Reconsider CTA utilization for low-yield indications, including headache and dizziness
Thoracic
CT for PE—utilize risk scoring methodology (i.e., Wells or PERC)
CT chest for lung parenchymal disease doesn’t require IV contrast
Abdomen/pelvis
Pancreatitis and pyelonephritis—CT rarely indicated for these diagnoses
For primary hepatobiliary concerns, right upper quadrant ultrasound remains an excellent choice, unless high likelihood that CT also needed to explain symptoms
GI Bleeding—reserve CTA for patients with bright red blood per rectum or hemodynamic instability in whom acute intervention might be needed
Trauma
CT torso with IV contrast is needed to assess for parenchymal or vascular injury.
Consider non-contrast CT torso imaging (or radiography) in patients with low suspicion for parenchymal or vascular injury, such as elderly patients with ground-level fall and suspicion for rib fracture or thoracic/lumbar spine fracture
Next, we required referrers to enter additional clinical information into a free text field describing why iodinated contrast was needed for the CT (Intervention 2; May 16, 2022).
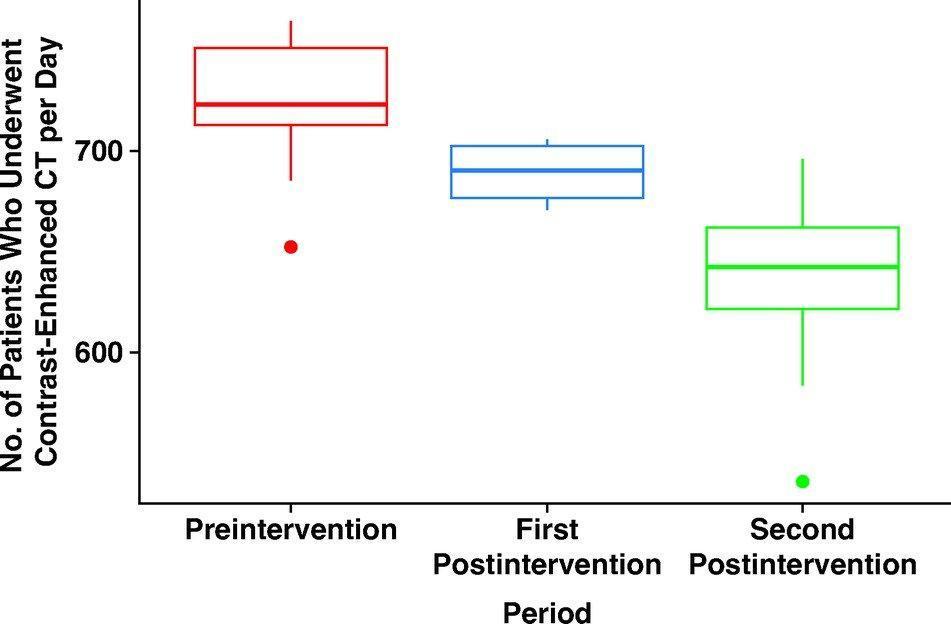
The number of patients undergoing contrast-enhanced CTs per day decreased from 726 prior to the interventions, to 689 after intervention 1, to 639 after intervention 2 (Fig. 2).
Fig. 2—Box-and-whisker plots show changes during preintervention and postintervention periods in number of patients who underwent contrast-enhanced CT examinations per day. Centerlines represent medians, ends of boxes represent interquartile ranges, ends of whiskers represent interdecile ranges, and dots beyond ends of whiskers represent outliers.
The overall number of patients undergoing CT per day decreased, as did the percentage of CT exams performed with IV contrast. These decreases were seen for all CT, as well as body CT alone (neck/chest/abdomen/pelvis). As expected, there was a decrease in requests for contrast-enhanced CT and a corresponding increase in requests for non-contrast CT.
In summary, an EHR intervention was able to reduce the number of contrast-enhanced CTs per day by 12%, the total number of CTs performed per day decreased 2.7%, and the percentage of CTs performed with IV contrast per day decreased from 53.8% to 48.6%. This simple intervention was implemented within weeks of the onset of the shortage and led to rapid practice change. Along with other conservation strategies, our health system was able to avoid rationing and continue near normal operations.
References
Wang CL, Asch D Cavallo J. Statement from the ACR Committee on Drugs and Contrast Media on the Intravenous Iodinated Contrast Media Shortage. J Am Coll Radiol 2022; 19:834-835
Grist TM, Canon CL, Fishman EK, Kohi MP, Mossa-Basha M. Short-, mid-, and long-term strategies to manage the shortage of iohexol. Radiol 2022; 304:2
Glazer DI, Lucier DJ, Sisodia RC. Electronic health record order entry–based interventions in response to a global iodinated contrast media shortage: impact on contrast-enhanced CT utilization. AJR 2022; 220:1
Over the last few years, we in radiology have faced incredible and unprecedented challenges in our day-to-day work, and this is true regardless of our specific work environments. Why? The pandemic, which has touched everyone, has had a profound impact on the workplace in general. It has changed how we work, approach work, and shaped our opinions of work. And it is not just the pandemic—it’s other phenomena: political polarization, social unrest, changes in home life and education, remote work. The pandemic and its effects led to a great resignation, and as a result, many of our sites are now understaffed. One in five doctors plan to leave their current practice in two years; two in five nurses plan to leave their practice in two years; one in three doctors expect to work less next year.
Health care workers have far greater demands now than in the pre-pandemic times. The delivery of health care has changed dramatically and quickly over the last few years. There is unprecedented “consumerism” in medicine now with a mandate to improve and rethink patient access, to provide more and better mental health services to our populations, and to have transparent pricing.
In radiology, whether you work in a large or small private practice, remotely by yourself, an academic department in a medical center, or part of a mega radiology practice, there has been a palpable shortage of radiologists. This shortage is fueled by a trend toward exclusive subspecialization with declining numbers of radiologists who can handle general work, ever-increasing expectations for service to our patients, referring doctors, hospitals, and health care systems. We have been stretched thinner. There is a desire by radiologists to have more flexible work hours or, simply stated, to work less hours overall compared to years past. There is a concern about what role artificial intelligence and machine learning will play; will we be displaced? Reimbursement has been decreasing relative to inflation and compared with other specialties. As a result of these realities and others, there is clear evidence of burnout among radiologists, similar to health care workers in other specialties. On top of that, sometimes, we find that the leaders in our organizations may be distant, or too corporate, or suffer from “toxic positivity,” which may be worse than “toxic negativity.”
There has been a steady headwind for years, but it now feels like a gale force wind. And a lot of this feels out of our control. So, goodness, how do we manage all of this?
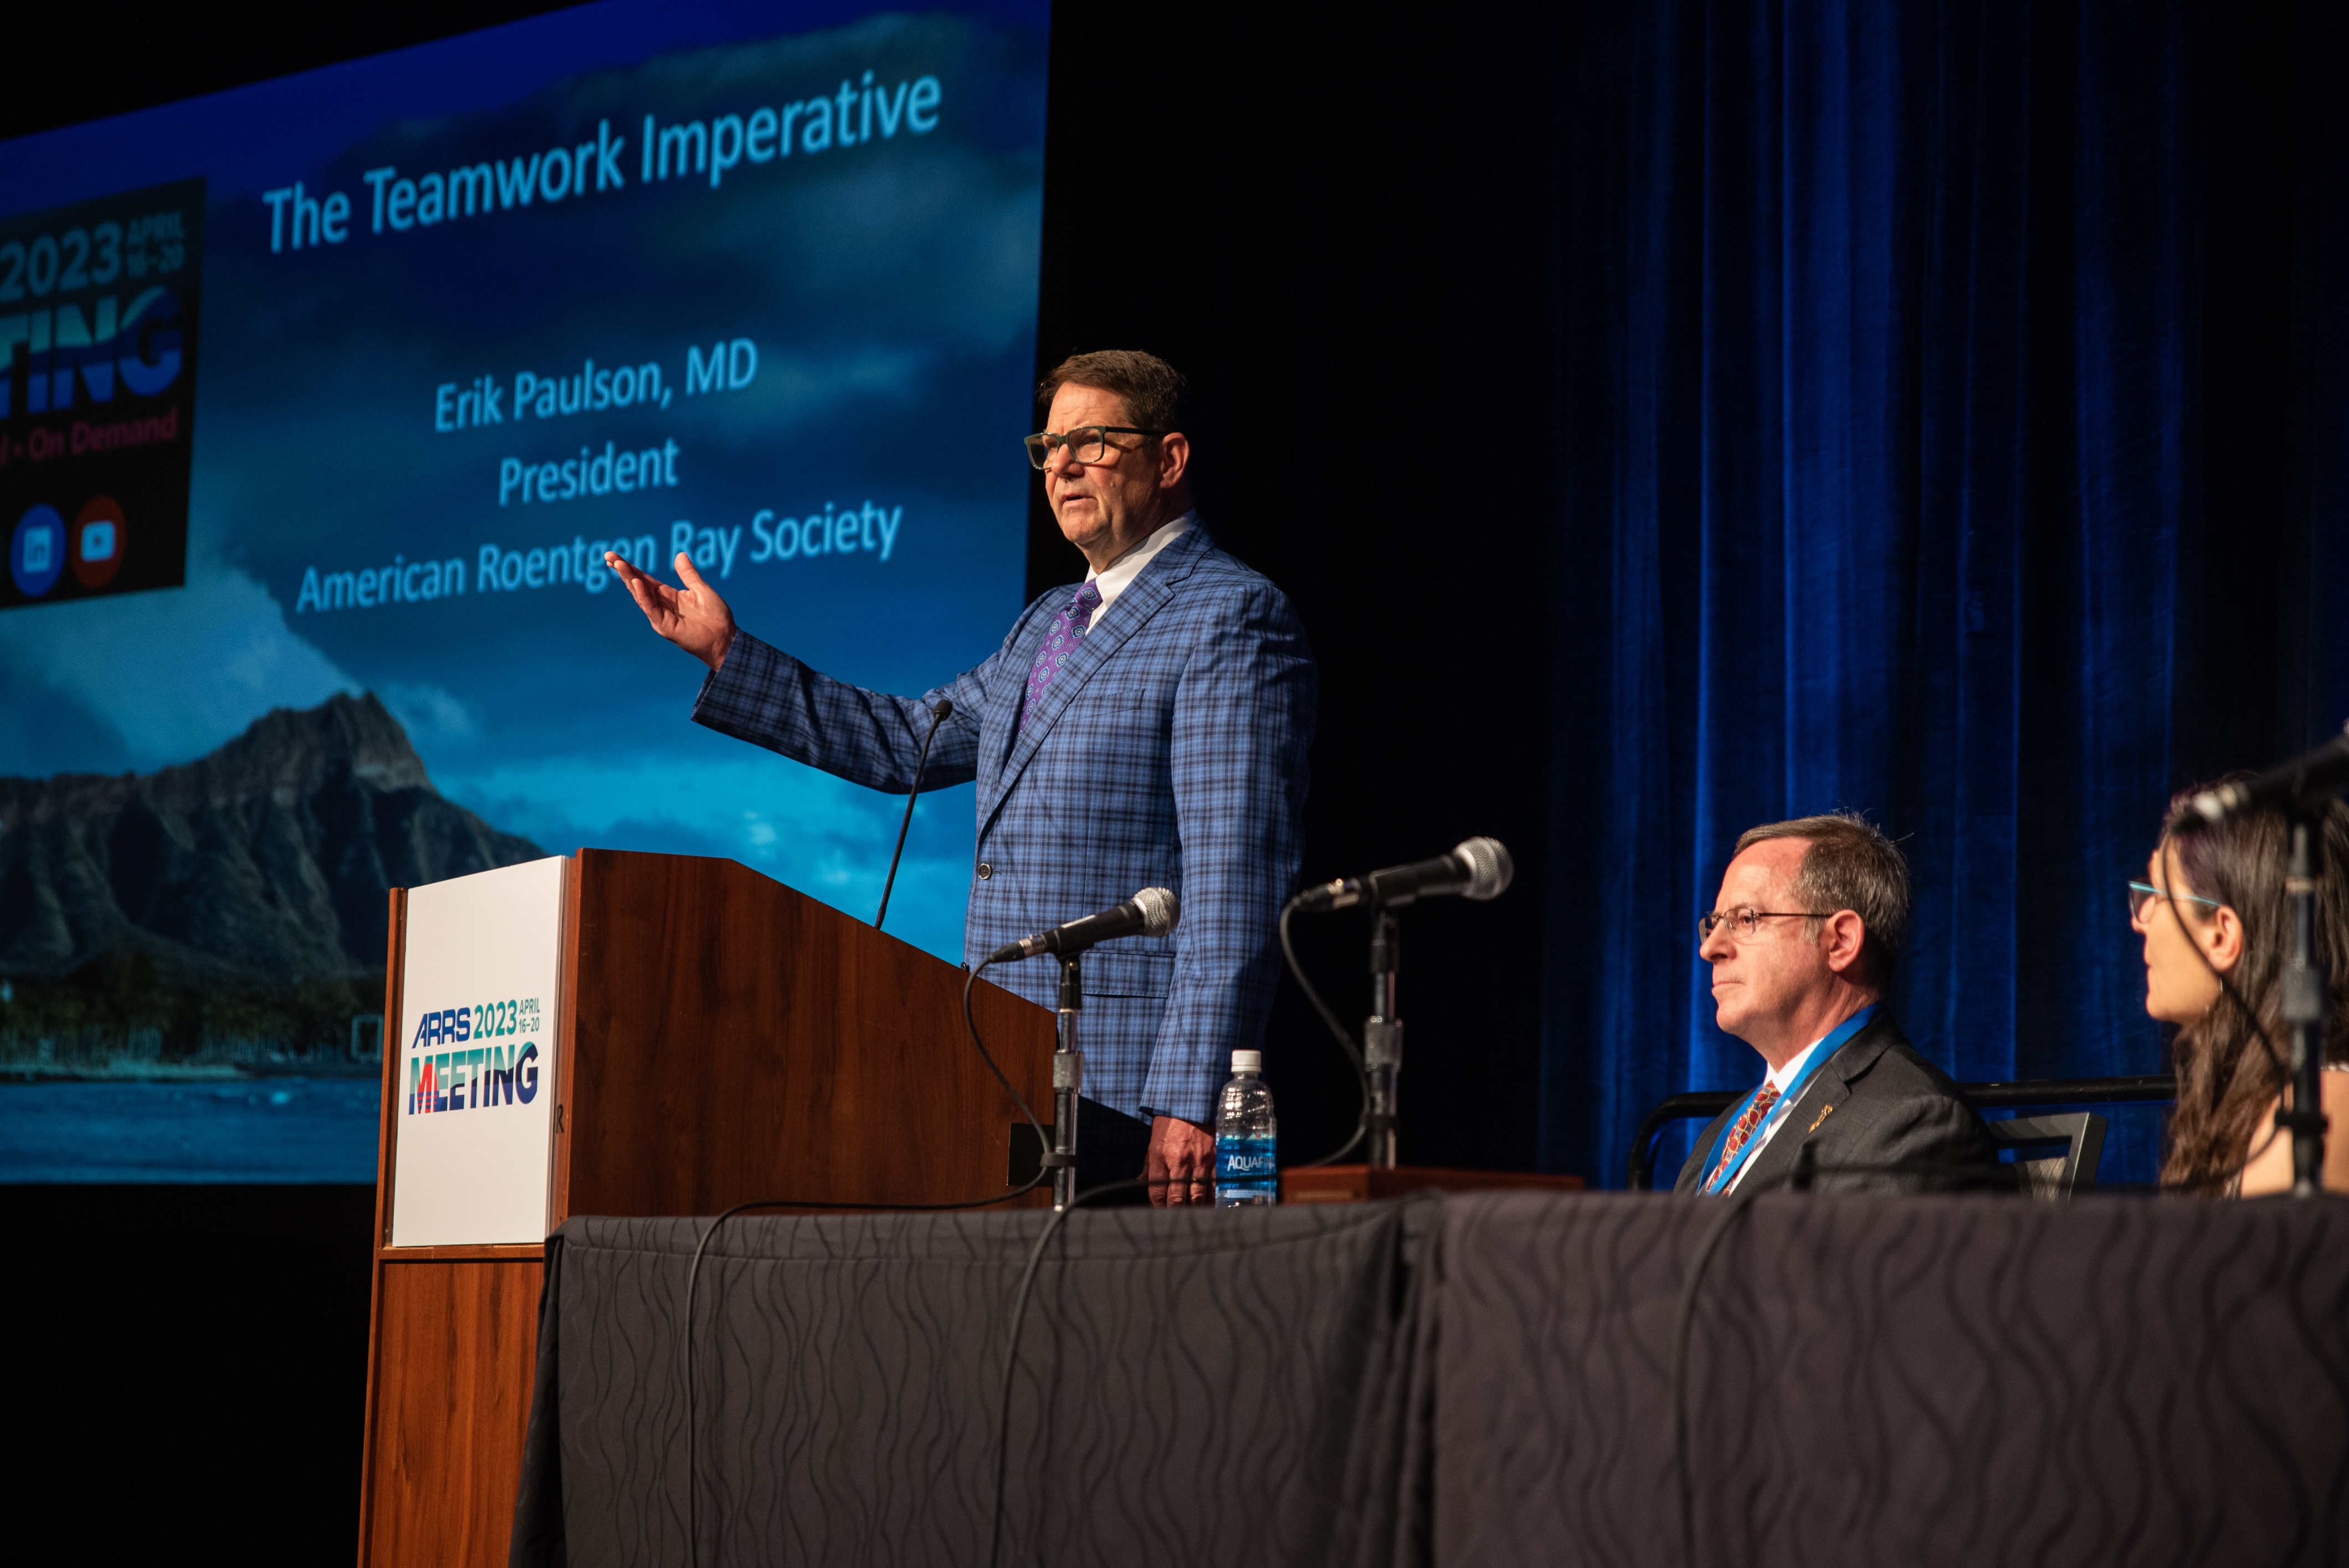
Hold on, let’s take a breath. One strategy that we can embrace and control is to develop a culture of teams within our workplaces. In fact, I have titled this series “The Teamwork Imperative” because we must establish teamwork as a core value within the radiology workforce. I believe that if we foster a culture of teams, we can mitigate and shield ourselves from some of these headwinds.
Obviously, I’m not the first to suggest the importance of teams. It’s all over the blogs and press and our literature. In last year’s presidential address, Dr. Gary Whitman alluded to the importance of a culture of resiliency and teamwork [1]. I will also shout out to the 2021 president of our society, Dr. Jonathan Kruskal. Dr. Kruskal, along with colleagues and ARRS staff, launched RadTeams.org—an open-access website that helps radiologists establish, grow, and sustain high-functioning radiology teams, along with other aspects of imaging wellness and wellbeing [2]. Check it out. And you have to revisit the exciting ARRS Radiology Wellness Summit from the Annual Meeting that addressed, among many things, the importance of teams [3, 4].
Let me be clear. Here, when I say teams, I am specifically not referring to the “macro teams” that many of us find ourselves in. For example, at Duke Health, it is said that the 30,000-plus employees are my “teammates.” That very well may be true. But no, I am referring to your local and focal team. I am referring to the individuals that you rely on daily or weekly to deliver your work product. It’s the folks you huddle with. And the teams develop where you huddle. If you are in training, I am referring to your team of co-residents, your chief residents, maybe your program director or program coordinator who you lean on. If you are in a private practice, I am referring to those that you share physical space with, or perhaps switch call with, or the individuals you show difficult cases to, or the referring docs you have developed close relationships with, and who rely on you to deliver care. In an academic environment like mine, it might be the members of your subspecialty division. If done well, the division pulls together as a team to deliver care, service, teaching, and research.
Those divisions that have a culture of team are far more effective than those who are unable to act as a team. If you are lucky enough to have these local and focal teams (and these often form and evolve organically), many challenges at work open up and become more manageable and attainable. The clouds begin to lift. Specifically, your deliverables, whatever they may be, are far more easily and effectively achieved if you have your team and approach your work from the perspective of that team.
Work becomes more efficient and fulfilling and, frankly, more fun. The work becomes more manageable, with more aspects under your control. You become more engaged. And that then becomes an antidote to burnout. Teams, therefore, contribute to retention.
Coaches discuss this all the time. Just as Dr. Whitman was fond of quoting UCLA basketball coach John Wooden in his InPractice columns [5, 6], I’ll borrow here from Mike Krzyzewski, the legendary Duke basketball coach. “Coach K” famously talked about the five keys to an effective team and likened the keys to the fingers on a hand. Each finger is individual and can stand alone, but when the fingers come together into a fist, the fist proves to be much stronger than the sum of the individual fingers.
Communication, trust, responsibility, caring, productivity—my next installments of “The Teamwork Imperative” will discuss all five of these fingers and more, so please do stay tuned!
ARRS RadTeams website. About page. RadTeams.org/About. Accessed July 26, 2023
Kruskal J, Azour L, Goldin J. Introducing the ARRS Radiology Wellness Summit in Hawaii—Time to Get Serious! ARRS InPractice website. www.radfyi.org/radiology-wellness-summit-arrs-2023-hawaii. Published August 1, 2022. Accessed July 26, 2023
Kruskal J, Azour L, Goldin J. A Lighthouse for Radiology Wellness. ARRS InPractice website. www.radfyi.org/a-lighthouse-for-radiologists. Published November 14, 2022. Accessed July 26, 2023
Whitman GJ. Be a Primary Radiologist. ARRS InPractice website. www.radfyi.org/primary-radiologist. Published August 5, 2022. Accessed July 26, 2023
Whitman GJ. Repairing the World. ARRS InPractice website. www.radfyi.org/repairing-the-world. Published November 4, 2022. Accessed July 26, 2023
Sadia R. Qamar, Ramin Hamidizadeh, Samad Shah, Patrick McLaughlin, Anto Sedlic, Savvas Nicolaou
Department of Radiology University of British Columbia
Memoona Mian
Department of Radiology University of Arkansas for Medical Sciences
Prompt and early diagnosis is vital for timely treatment of traumatic cardiac emergencies. Myocardial rupture is a rare cause of immediate death after blunt cardiac trauma, with only 0.3–1.1% of patients with trauma reaching the emergency department (ED) [1]. Pericardial tears caused by deceleration forces or rib cage fractures are uncommon after blunt chest trauma, with a frequency of 0.3–0.5%. Rarely, valvular dysfunction can be seen due to an abrupt raised intracardiac pressure against a closed valve resulting from sudden rise in intraabdominal pressure translating into the heart causing valve cusp avulsion or tear [2]. Penetrating trauma can result in pericardial injuries further complicated by life-threatening conditions including partial or complete transdefect cardiac herniation or luxation with a mortality rate as high as 67%.
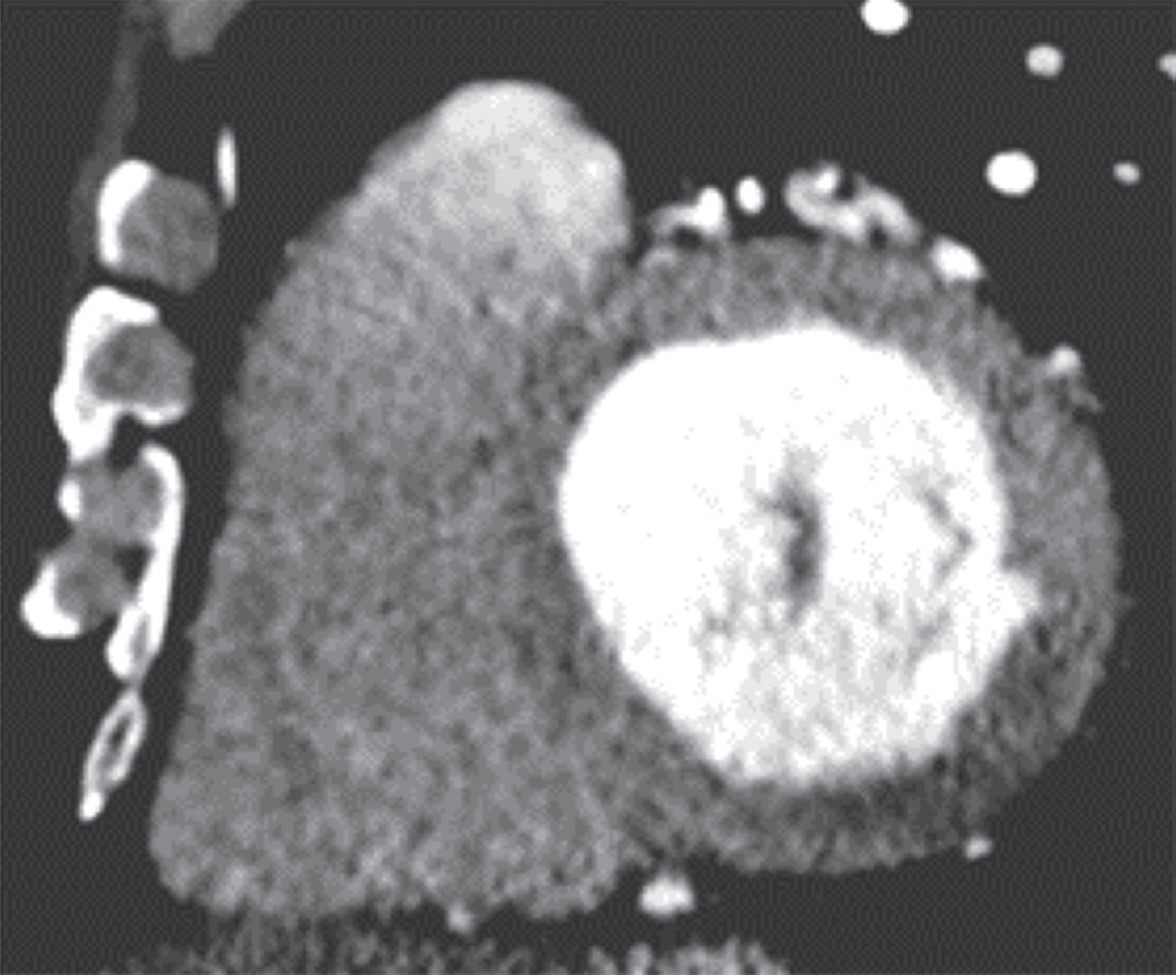
Plain radiographs will show pneumopericardium, hydrothorax or hemothorax, and mediastinal hematoma. Echocardiography will show abnormal valve function; wall motion abnormalities with decreased left ventricular ejection fraction; and pericardial effusion, signs of cardiac tamponade, or both. CT will show pneumopericardium, pericardial effusion, pericardial or myocardial laceration or rupture, cardiac herniation or luxation with associated SVC obstruction or right heart strain, valvular cusp avulsion or tears, coronary artery dissection or rupture, and associated rib cage fractures, retained foreign bodies, bullet fragments, and wound tracks [3] (Fig. 1).
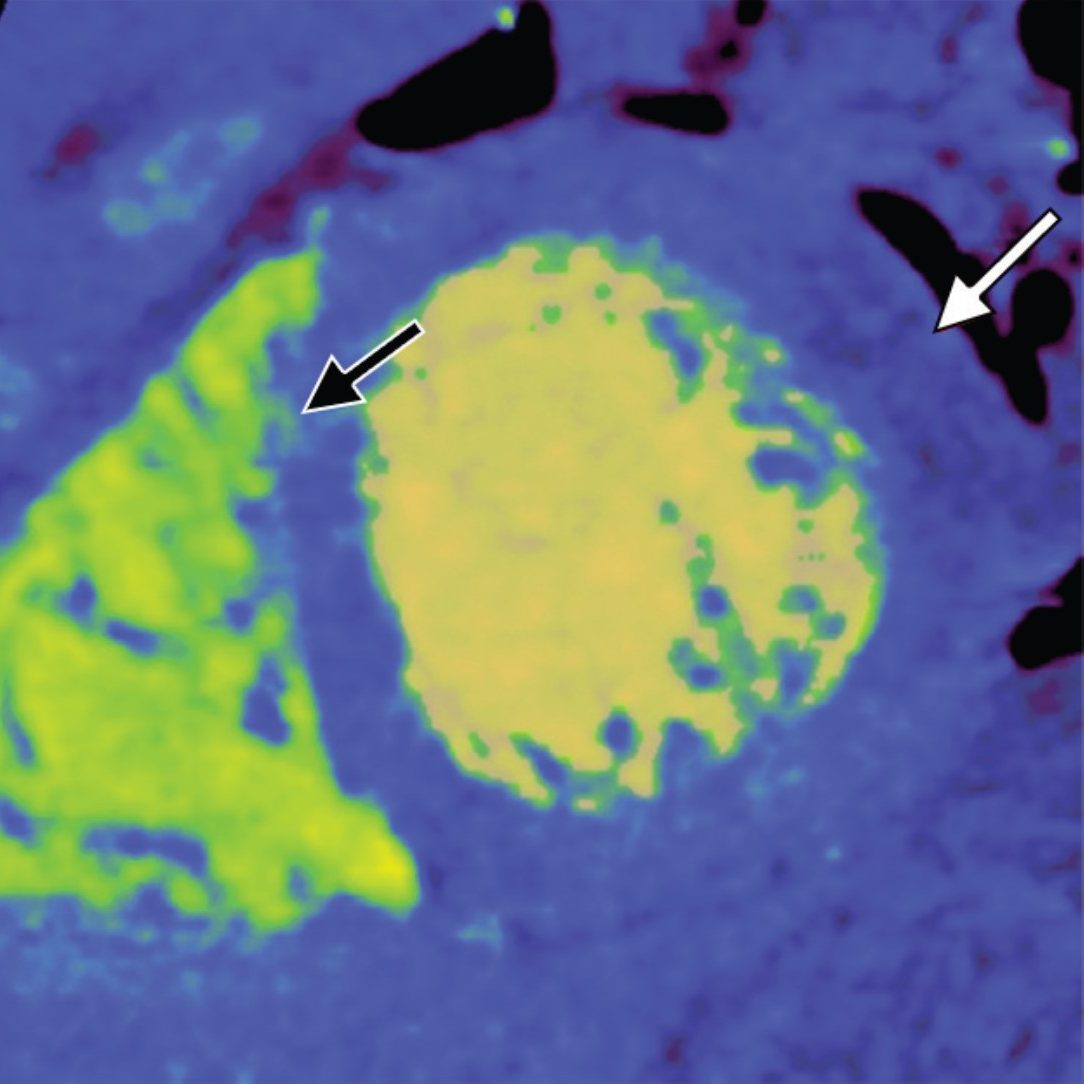
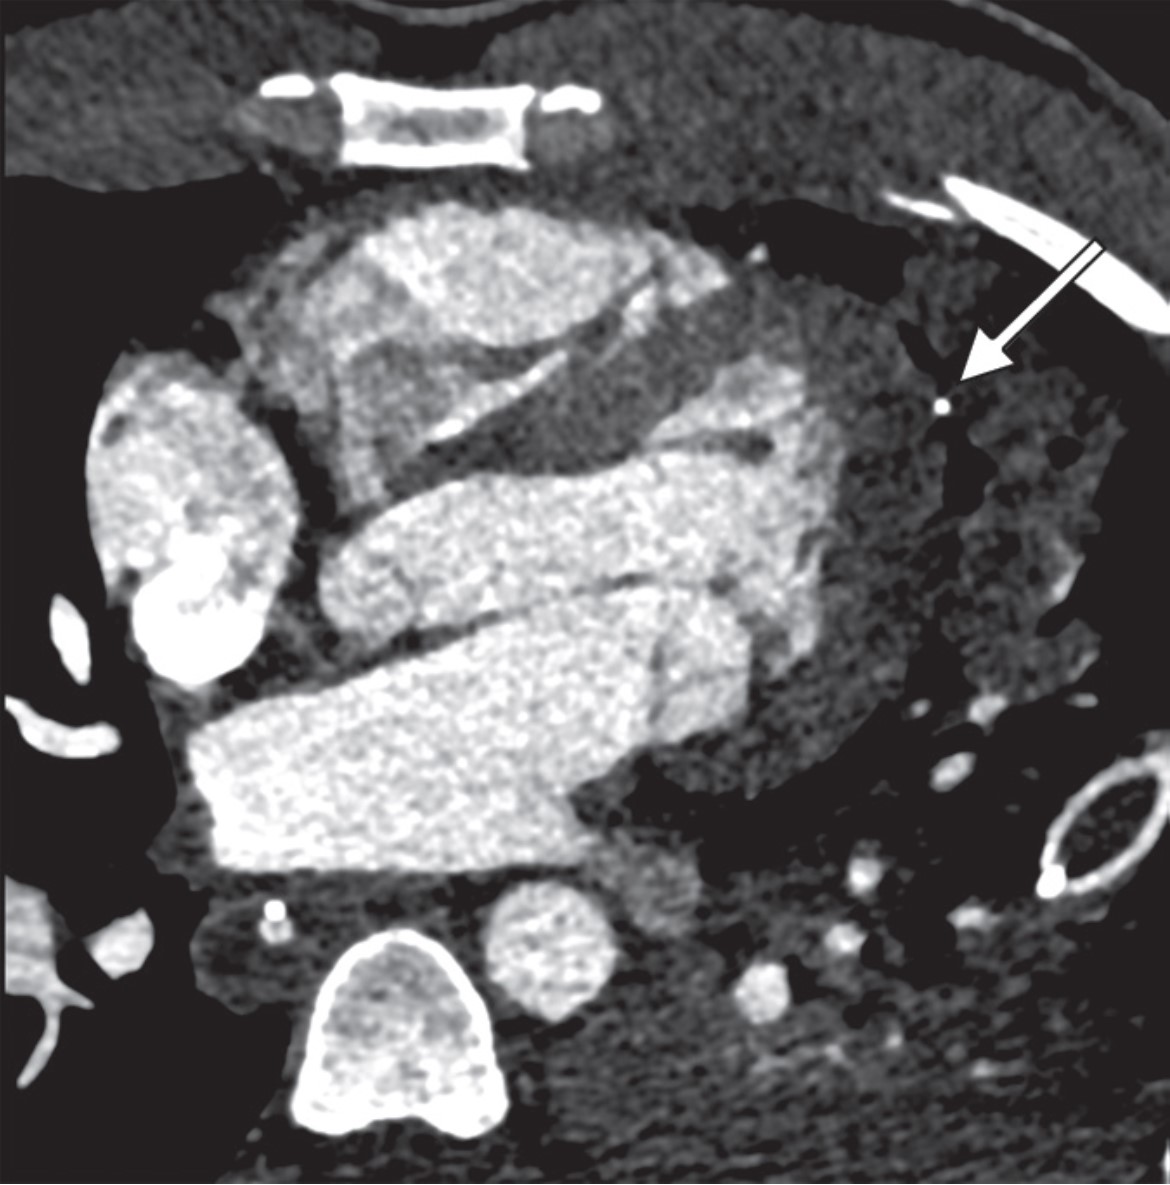
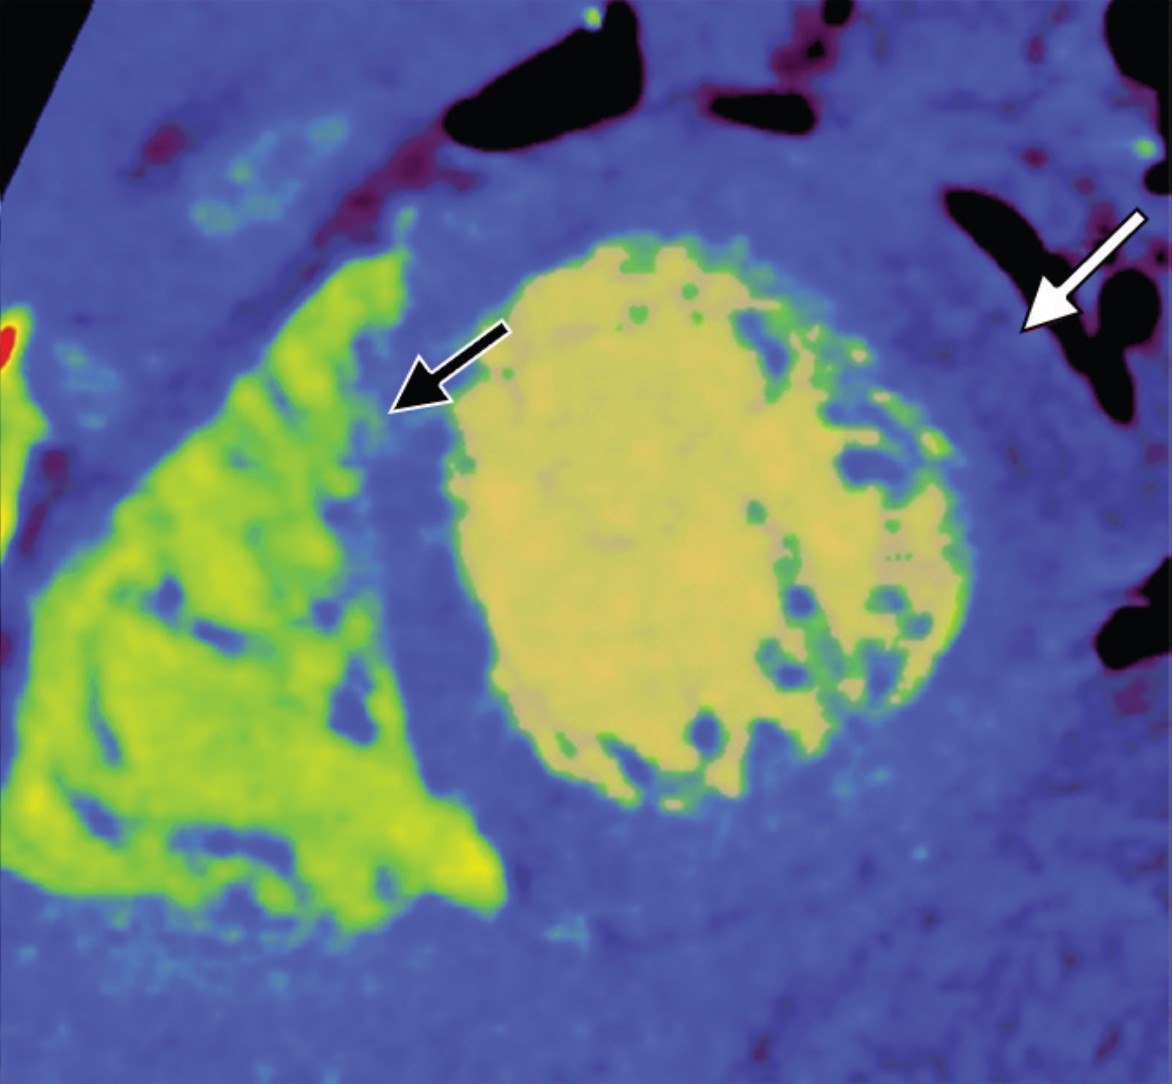
Fig. 1—29-year-old man with gunshot wound. Left, Axial four-chamber cardiac CT image shows bullet fragment (arrow) abutting left ventricular side wall at mid cardiac level without myocardial penetration. Right, Mid ventricle short-axis color-coded functional cardiac CT image depicts reduced perfusion (white arrow) consistent with myocardial contusion. Black arrow indicates bullet fragment.
Imaging Pearls and Pitfalls in Cardiac Trauma
Any pericardial effusion detected in the acute trauma setting is presumed to be hemopericardium until proven otherwise. CT provides valuable information about the possible nature of pericardial effusions on the basis of the attenuation measurements of the collection. Coronary artery injuries are rare (in less than 2% of chest trauma cases), with left anterior descending artery being most commonly injured [4]. Penetrating cardiac trauma can result in pericardial injuries, which can result in partial or complete transdefect cardiac herniation or luxation with mortality up to 70% [5]. Portable supine studies in ED are suboptimal with overlying artifacts, which limits evaluation. TEE is invasive and difficult to perform in patients with acute craniocervical injuries. Cardiac MRI in trauma is primarily useful as a problem-solving tool after patients are admitted, especially to delineate the extent of myocardial contusion, regional infarction, wall motion abnormality, and valvular dysfunction.
Limitations of MDCT
First, CT involves use of ionizing radiation which increase the radiation exposure in the population. Second, the quality of MDCT images suffers with fast heart rate and high calcium burden. Finally, the patients with arrhythmias, ectopy or misregistration ECG artifacts degrade the image quality and limit evaluation. Optimizing techniques should be incorporated to counter these limiting factors.
Reduction of Radiation Dose
Radiation dose can be reduced with a prospective ECG-gated technique with narrow window acquisition, ECG tube current modulation, and limited pulse windows; tube voltage reduction based on body mass index; automated tube voltage reduction based on topogram attenuation profile; adaptive collimation limiting helical over spiral scanning; and iterative reconstructive techniques to reduce noise and ultimately reduce dose.
Optimizing Quality of Cardiac CT
Several steps can be taken to optimize the quality of cardiac CT studies. A heart rate of less than 65 beats/min can be achieved by administering 5–20 mg of β-blocker (metoprolol) IV or 50–100 mg by mouth 1 hour before the CT. Lowering the heart rate widens diastole and decreases beat-to-beat variability. Coronary arterial dilatation for optimal visualization can be achieved by administering 0.4–0.8 mg of nitroglycerin sublingually 5 minutes before contrast injection. Reconstruction algorithms can be used to reduce beam-hardening artifacts from iodine that mimic ischemia (Fig. 2).
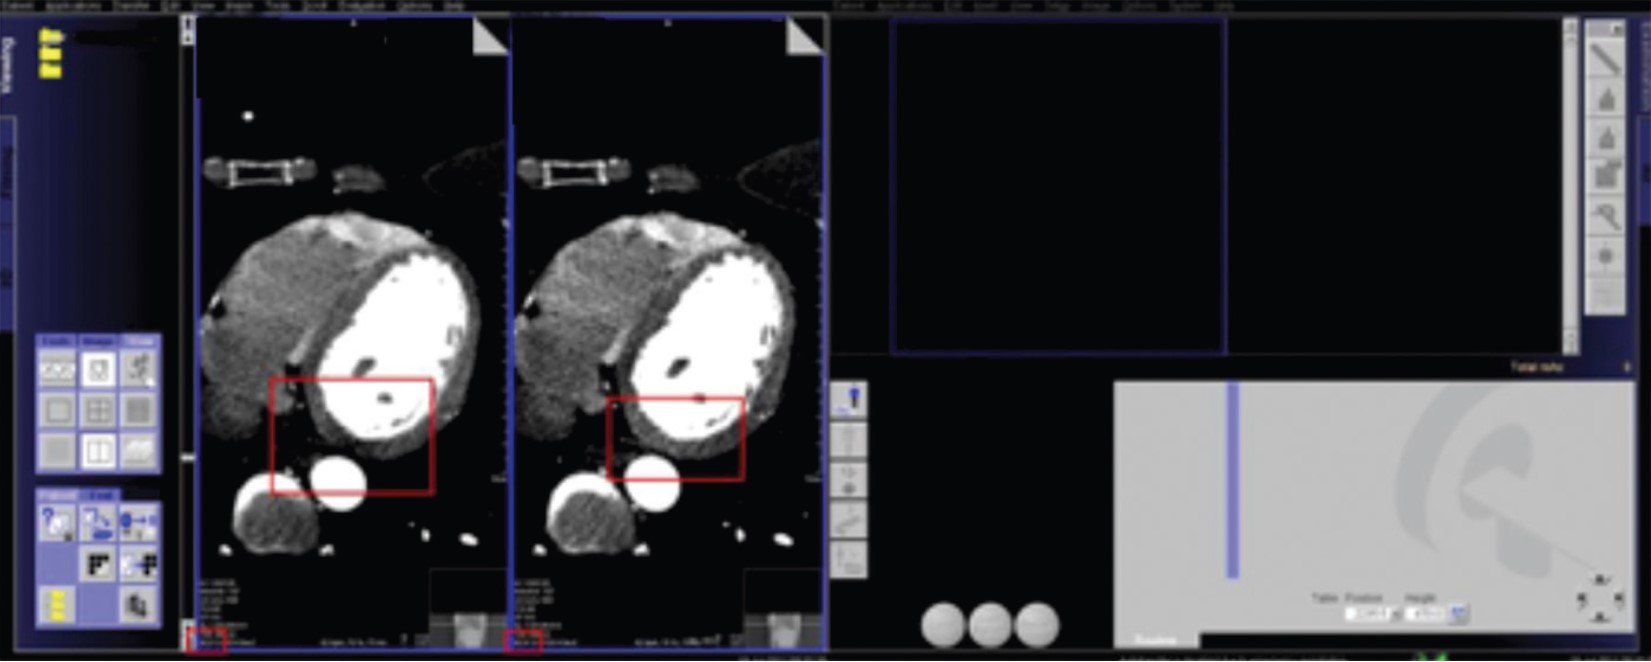
Fig. 2—CT images show beam-hardening correction (left) and utility of B23 kernel (right) as it reduces beam-hardening artifact from iodine in left ventricle and thoracic aorta, affecting posterior inferior aspect of left ventricle wall mimicking infarct.
Edge-enhancing reconstruction algorithms can be used to reduce noise caused by extensive coronary calcifications or coronary stents.
Emerging Applications and Outlook
Coronary Atherosclerotic Plaque Characterization
The rationale behind growing efforts to accurately characterize a vulnerable, predominantly lipid-rich, plaque is its grave association with ACS and SCD. Novel attenuation-based application of dual-energy CT (DECT) has shown promising results when correlated with histologic findings. Spectral attenuation curves for material characterization are generated using attenuation values of a specific material for each and every monochromatic energy ranging from 40 to 140 keV [6]. Lipid-rich atherosclerotic plaques share the known attenuation curve of fat, in which attenuation decreases with lower monochromatic energy, thus differentiating lipid-rich plaques from fibrous plaques [7].
CT-Derived Fractional Flow Reserve
Coronary blood-flow volume effectively provides an estimation of lesion-specific ischemia. Recent vigorous advancements in digital analysis of fluid dynamics allow noninvasive assessment of coronary flow on the basis of mathematic models. CT-derived fractional flow reserve (FFR) calculates lesion-specific FFR using static coronary CT data without additional radiation or modification in image acquisition protocols. Studies have found that CT FFR shows 90% sensitivity and nearly 83% specificity for lesions with moderate stenosis causing ischemia [38]. A multicenter prospective trial showed 73% specificity and 90% sensitivity for CT FFR in diagnosing obstructive CAD compared with conventional angiographic FFR [8].
CT Myocardial Perfusion and Viability
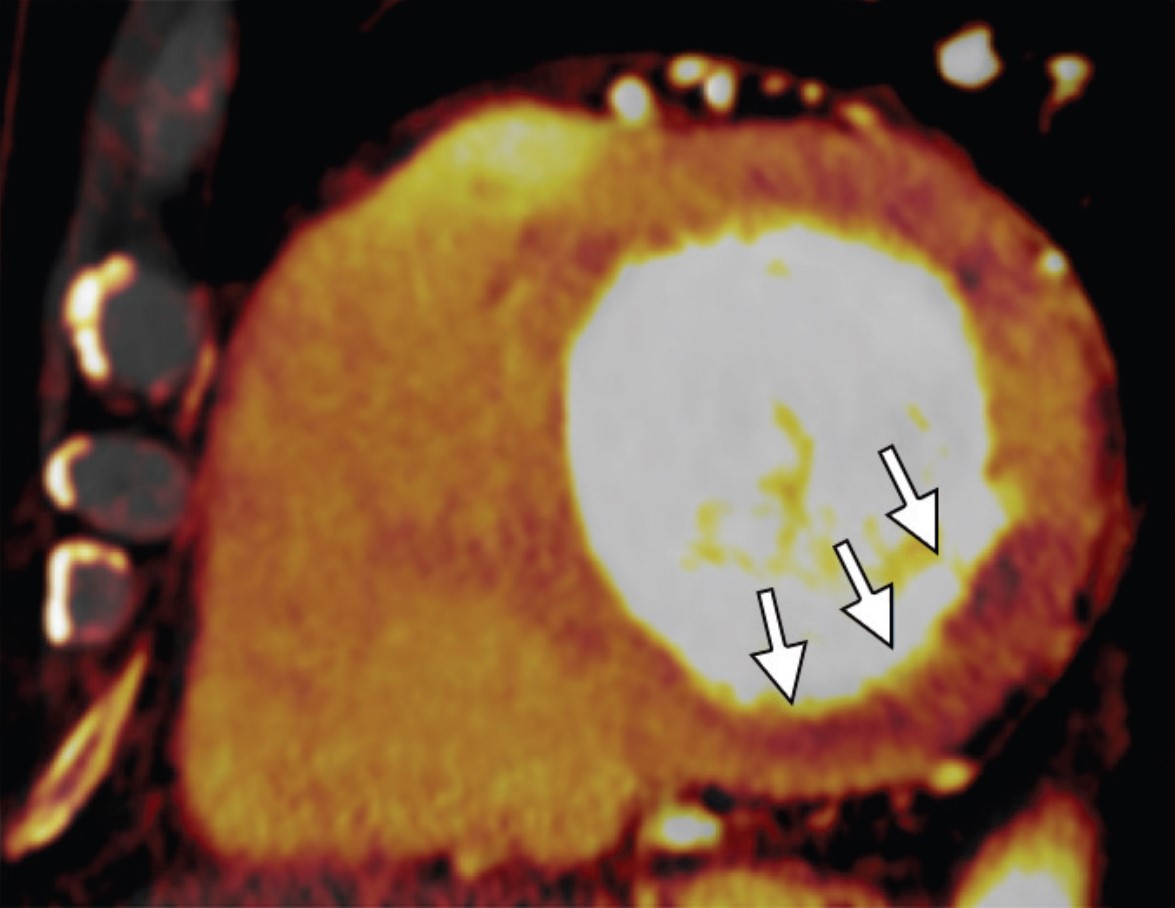
Myocardial perfusion is one of the most important prognostic indicators for patient outcome and management of CAD. CT myocardial blood pool analysis using myocardial iodine content is a promising dynamic technology. DECT color-coded iodine maps permit sensitive detection of myocardial perfusion by depicting myocardial blood pooling [9]. The perfused myocardium takes up iodine, but no iodine uptake is seen in the infarcted myocardium (Fig. 3). Assessment of myocardial viability predicts successful revascularization therapy.
Fig. 3—Myocardial ischemia in 51-year-old man. Left and right, Mid ventricle short-axis cardiac CT image (left) and iodine perfusion map (right) show decreased subendocardial iodine uptake (arrows) in inferior basal ventricle, suggesting perfusion defect consistent with myocardial ischemia.
MDCT is a viable, reliable, and potentially effective imaging modality in evaluation of coronary and noncoronary cardiac emergencies. Cardiac CT efficiently rules out CAD in patients with low to intermediate risk who present with acute chest pain in the ED and accurately predicts midterm adverse outcome. With integration of innovative applications like morphologic plaque characterization, coronary FFR and myocardial perfusion, cardiac CT will be able to offer unprecedented benefits, ranging from triage to treatment decisions in the ED.
References
Mirvis SE. Imaging of acute thoracic injury: the advent of MDCT screening. Semin Ultrasound CT MR 2005; 26:305–331
Farhataziz N, Landay MJ. Pericardial rupture after blunt chest trauma. J Thorac Imaging 2005; 20:50–52
Sohn JH, Song JW, Seo JB, et al. Pericardial rupture and cardiac herniation after blunt trauma: a case diagnosed using cardiac MRI. Br J Radiol 2005; 78:447–449
Bruschi G, Agati S, Iorio F, Vitali E. Papillary muscle rupture and pericardial injuries after blunt chest trauma. Eur J Cardiothorac Surg 2001; 20:200–202
Prêtre R, Chilcott M. Blunt trauma to the heart and great vessels. N Engl J Med 1997; 336:626–632
Beckman JA, Ganz J, Creager MA, Ganz P, Kinlay S. Relationship of clinical presentation and calcification of culprit coronary artery stenoses. Arterioscler Thromb Vasc Biol 2001; 21:1618–1622
Min JK, Leipsic J, Pencina MJ, et al. Diagnostic accuracy of fractional flow reserve from anatomic CT angiography. JAMA 2012; 308:1237–1245
Yoon YE, Choi JH, Kim JH, et al. Noninvasive diagnosis of ischemia-causing coronary stenosis using CT angiography: diagnostic value of transluminal attenuation gradient and fractional flow reserve computed from coronary CT angiography compared to invasively measured fractional flow reserve. JACC Cardiovasc Imaging 2012; 5:1088–1096
Han R, Sun K, Lu B, Zhao R, Li K, Yang X. Diagnostic accuracy of coronary CT angiography combined with dual-energy myocardial perfusion imaging for detection of myocardial infarction. Exp Ther Med 2017; 14:207–213
Living more sustainably has been on my mind recently, and I believe other radiologists may be interested, given our dedication to health care and wellbeing. As a radiologist, we play a crucial role in diagnosing and treating patients, and I strongly believe we can do even more.
Radiology, being an essential component of modern health care, has its environmental impact, particularly in terms of energy consumption and waste generation. However, I believe there are opportunities for positive change. By adopting sustainable practices in our radiology departments, we can reduce our ecological footprint and contribute to a healthier planet.
I’d love to discuss potential initiatives we could undertake together, such as our use of iodinated contrast media (ICM). ICMs accumulate as waste (residual in vials and tubing) and are released into the sewage system by patients who received ICMs. While ICMs are of low toxicity, they may be transformed into other chemicals when undergoing wastewater treatment, and/or drinking water purification. Those byproducts may pose a risk for the aquatic environment and our drinking water.
Following the shortage of iodinated contrast agents during the pandemic, many radiology practices had to adopt practices to decrease the use and waste of iodinated IV contrast. Why not adjust contrast volume for each patient based on body weight, lean body mass, or body surface? Certain imaging techniques can allow reduced IV contrast volumes, currently mostly used for patients with renal disease: low-kV techniques, dual-energy scanning with reconstruction of low-keV images, and contrast boost technique for CT angiography.
Using multi-patient injection systems for bottle sizes up to 500 ml can make IV contrast administration even more efficient by individualizing the amount of contrast material injected without increasing contrast waste. Yes, true, it may require some planning ahead of the imaging day to do this efficiently.
Changing habits can be difficult. Do you switch the lights off when you leave a room in your home? At work? It’s tough to remember to do it. It often feels like a big effort to change habits, and it is unclear whether a small contribution can make a difference.
Hang in here—the 1% rule (“rule of marginal gains”) is the idea that big goals can be achieved through small steps. No need for making big changes overnight. Instead, let’s aim for small daily improvements.
The three “r”s of sustainability—reduce, reuse, recycle—translate to radiology, and there are a few low-hanging fruits worth considering. What about adopting environmentally friendly practices that also save money? Rethinking how we administer iodinated contrast can be a feasible first step.
Director for Quality, Department of Radiology, Children’s Healthcare of Atlanta Interim Director for Quality, Department of Radiology and Imaging Sciences, Emory Healthcare Professor, Emory University School of Medicine
I am deeply honored and grateful to serve as the 123rd president of the American Roentgen Ray Society (ARRS). As you know, our society is the oldest radiology society, and we are widely regarded as the education society.
As a medical student, I started perusing the radiology journals; they were on library shelves back then, and there was the gray one and the yellow one. I loved the one with the yellow cover, the American Journal of Roentgenology, and I have ever since. Indeed, the ARRS was the first radiology society that I became aware of. I joined the society as a radiology resident, and I have been a member ever since.
Now, as ARRS president, I encourage all of our learners to join.
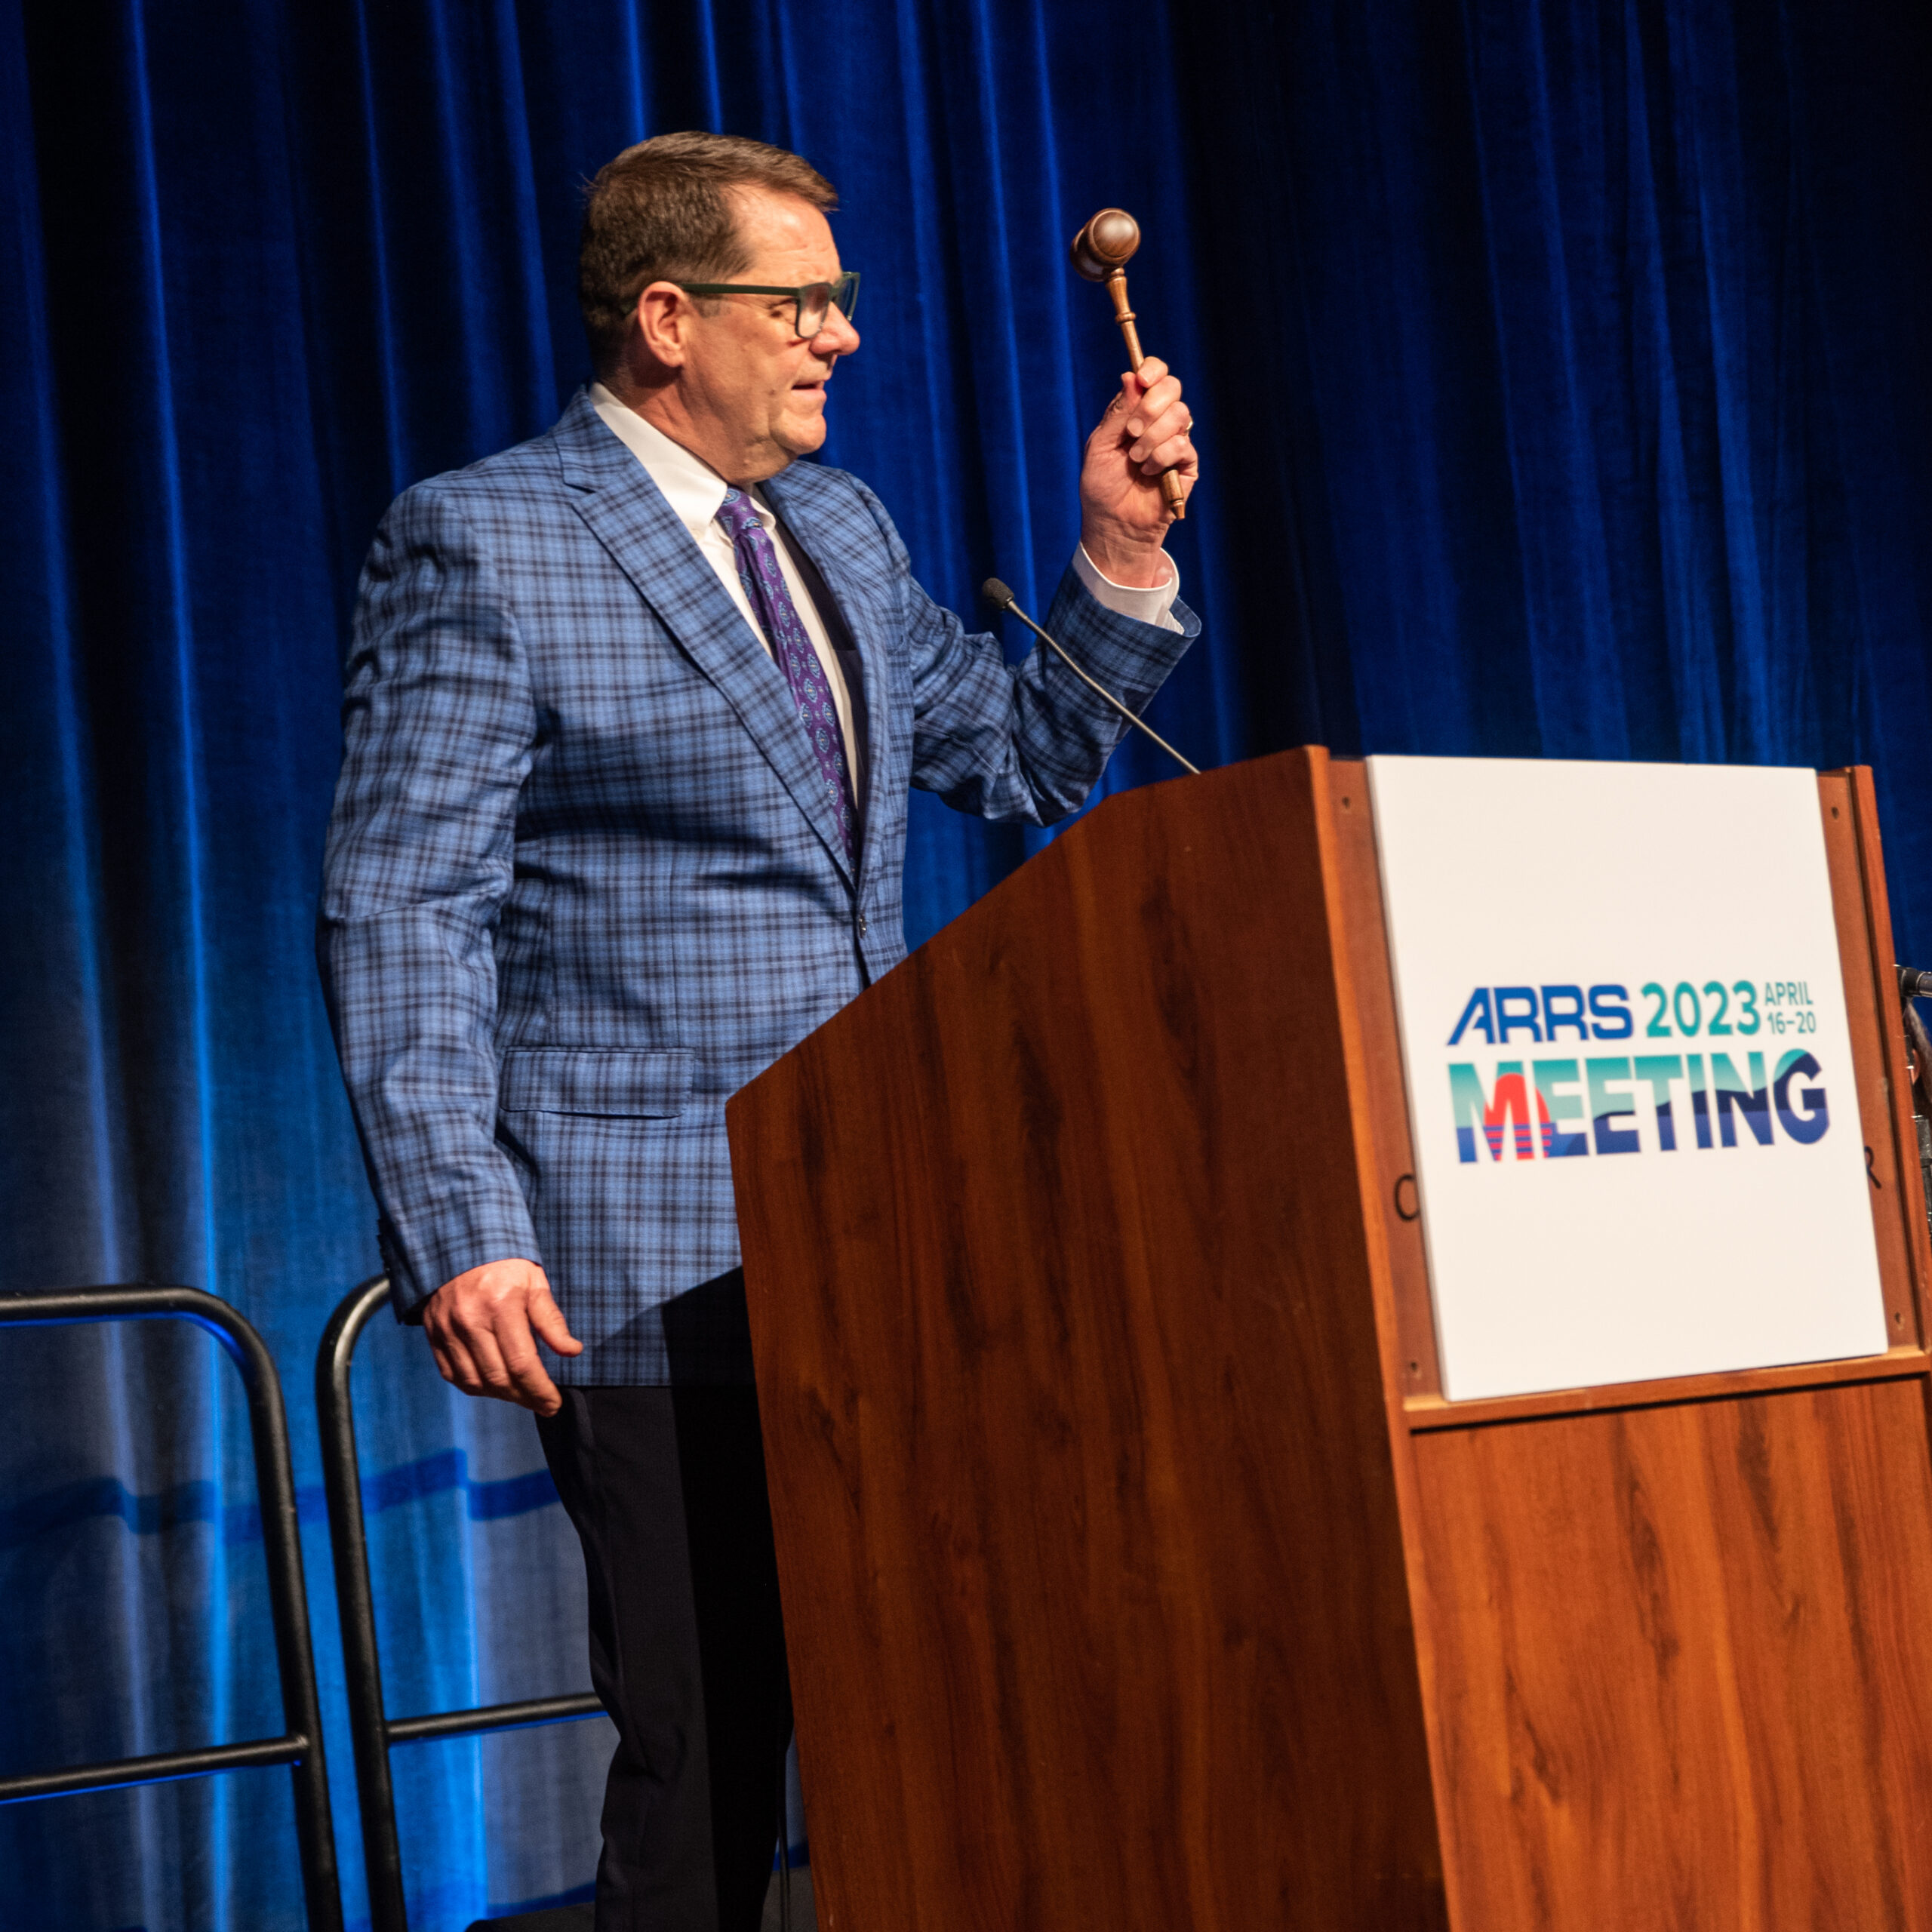
Left to right: Erik K. Paulson, Gary J. Whitman, and Deborah A. Baumgarten on stage during the Opening Ceremony of the 2023 ARRS Annual Meeting in Honolulu, HI.
It takes a team to run the society, and we have one. I would like to thank the hardworking and dedicated members of our Executive Council. Also, I would like to thank the Executive Committee of the Council, consisting of president-elect Angelisa M. Paladin, MD; vice president Deborah A. Baumgarten, MD, MPH; and secretary-treasurer Christine M. Glastonbury, MD.
Left to right: Nadja Kadom, Courtney Coursey Moreno, Christine M. Glastonbury, and Angelisa M. Paladin enjoy front-row seating at the Hawaii Convention Center.
A special and large thanks to outgoing ARRS president Gary J. Whitman, MD, who did a fabulous job in many respects.
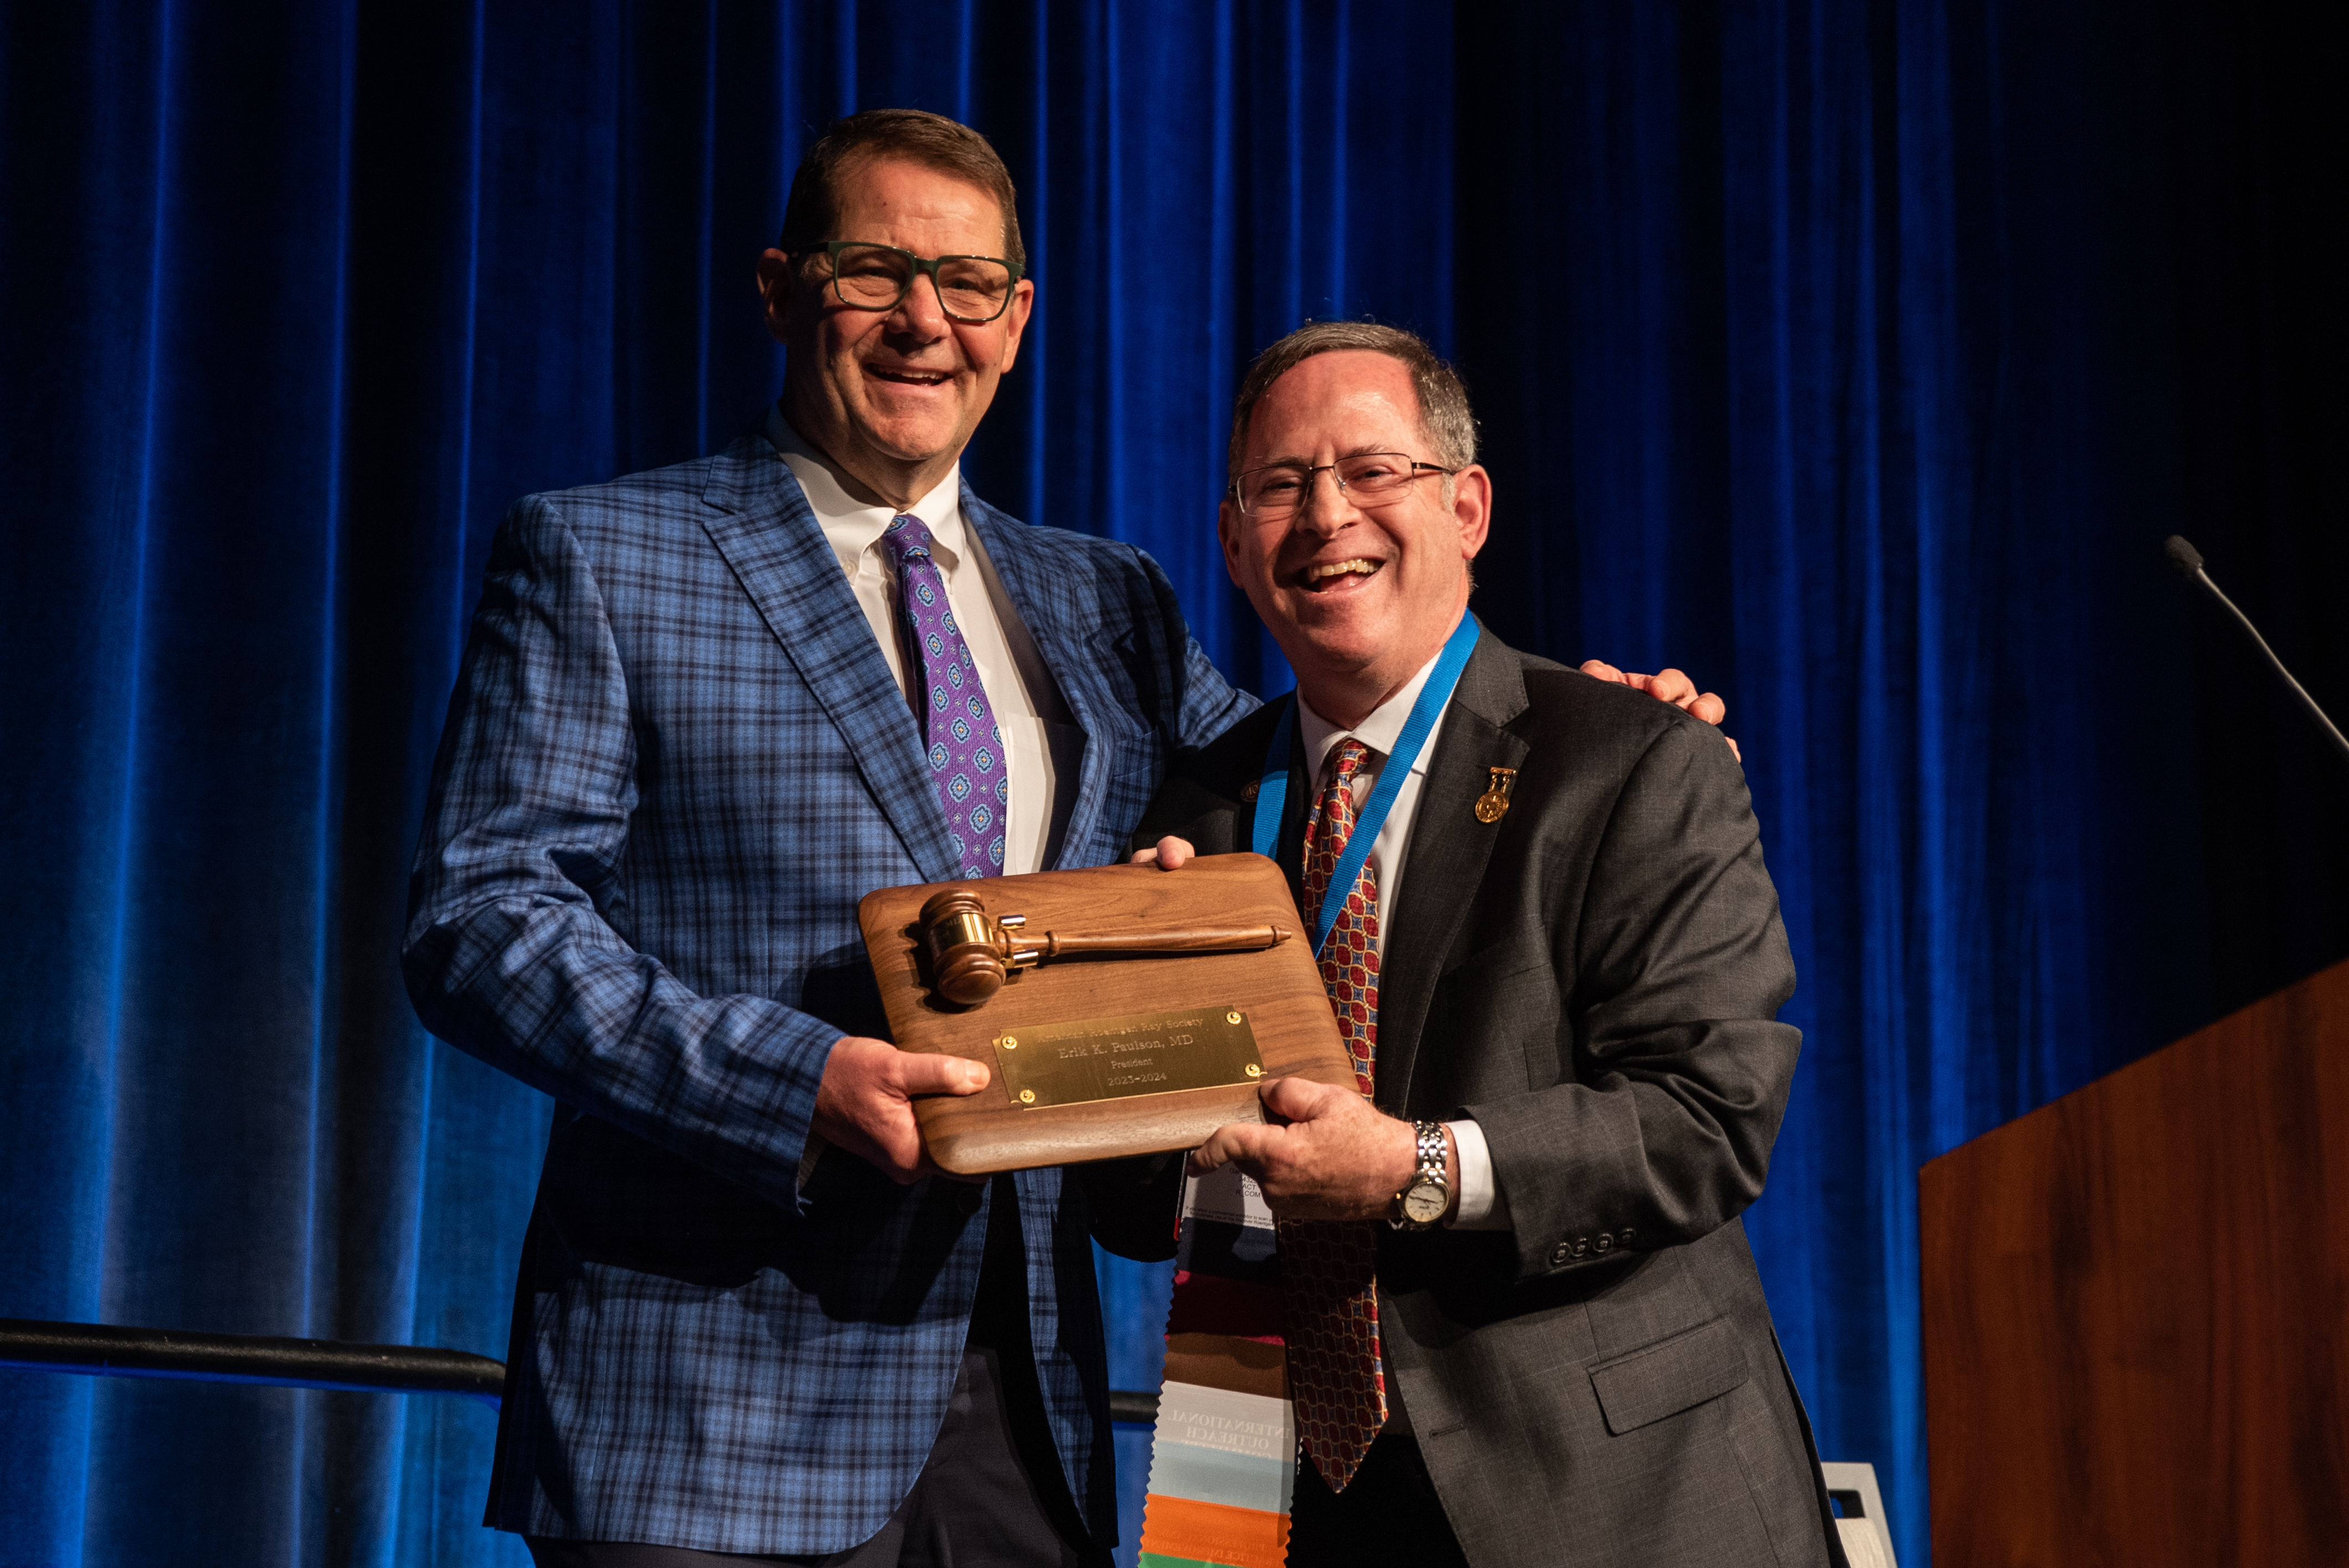
Dr. Paulson receives the ARRS presidential gavel from Dr. Whitman on Sunday, April 16, 2023.
In addition, Susan B. Cappitelli, MBA, CAE, and her excellent ARRS staff deserve robust recognition. And thanks to all of our almost 20,000 dedicated members, who we serve, of course.
Importantly, I would like to thank my family and my wife, Kathy Merritt, who has been a rock of support throughout my entire career.
Over the last few years, we in radiology have faced incredible and unprecedented challenges in our day-to-day work, and this is true regardless of our specific work environments. Why? The pandemic, which has touched everyone, has had a profound impact on the workplace in general. It has changed how we work, approach work, and shaped our opinions of work. And it is not just the pandemic—it’s other phenomena: political polarization, social unrest, changes in home life and education, remote work. The pandemic and its effects led to a great resignation, and as a result, many of our sites are now understaffed.One in five doctors plan to leave their current practice in two years; two in five nurses plan to leave their practice in two years; one in three doctors expect to work less next year.
Health care workers have far greater demands now than in the pre-pandemic times. The delivery of health care has changed dramatically and quickly over the last few years. There is unprecedented “consumerism” in medicine now with a mandate to improve and rethink patient access, to provide more and better mental health services to our populations, and to have transparent pricing.
In radiology, whether you work in a large or small private practice, remotely by yourself, an academic department in a medical center, or part of a mega radiology practice, there has been a palpable shortage of radiologists. This shortage is fueled by a trend toward exclusive subspecialization with declining numbers of radiologists who can handle general work, ever-increasing expectations for service to our patients, referring doctors, hospitals, and health care systems. We have been stretched thinner. There is a desire by radiologists to have more flexible work hours or, simply stated, to work less hours overall compared to years past. There is a concern about what role artificial intelligence and machine learning will play; will we be displaced? Reimbursement has been decreasing relative to inflation and compared with other specialties. As a result of these realities and others, there is clear evidence of burnout among radiologists, similar to health care workers in other specialties. On top of that, sometimes, we find that the leaders in our organizations may be distant, or too corporate, or suffer from “toxic positivity,” which may be worse than “toxic negativity.”
There has been a steady headwind for years, but it now feels like a gale force wind. And a lot of this feels out of our control.
So, goodness, how do we manage all of this?
Hold on, let’s take a breath. One strategy that we can embrace and control is to develop a culture of teams within our workplaces. In fact, I have titled this InPractice series “The Teamwork Imperative” because we must establish teamwork as a core value within the radiology workforce. I believe that if we foster a culture of teams, we can mitigate and shield ourselves from some of these headwinds. During my term as your ARRS president, future installments of “The Teamwork Imperative” here in InPractice will feature specific thoughts on this subject, borrowing some thoughts from the game of basketball’s great coaches.
To officially kick off the 123rd meeting of the ARRS, Lopaka Kapanui, the island’s foremost practitioner of oli kāhea (entrance chant), welcomed society members from more than 40 countries with the open hand and heart of aloha—duly noting “e mau ana ka ‘ike” (the knowledge must continue).
Erik K. Paulson
Erik K. Paulson, MD, chair of the radiology department at Duke University, was installed as the 123rd president of ARRS. “I am absolutely honored and delighted to serve as the president of our country’s oldest radiology society, a society whose sweet spot is member education,” Dr. Paulson said during his opening remarks at the Hawaii Convention Center. “It takes a team, though,” he acknowledged. And joining Dr. Paulson are the following newly elected ARRS officers for 2023–2024: Angelisa M. Paladin, President-Elect; Deborah A. Baumgarten, Vice President; and Christine M. Glastonbury, Secretary-Treasurer.
Dr. Paulson succeeds Gary J. Whitman, MD. Having presided over our society ably and honorably from 2022 to 2023, Dr. Whitman presented this year’s coveted ARRS awards. The first laurels of the morning went to Bernard F. King, Jr., MD, FACR, FSAR, the 117th President of ARRS, who was awarded the 2023 ARRS Gold Medal. The highest distinction bestowed by ARRS, our Gold Medal has been honoring distinguished service to radiology for more than four decades.
Bernard F. King, Jr.
Jon A. Jacobson, MD, FACR, was then recognized as the 2023 ARRS Distinguished Educator. The ARRS Distinguished Educator award recognizes outstanding individuals in the field of medical imaging, who have a proven record of improving radiological education and remain committed to creating and implementing new and innovative educational activities.
Jon A. Jacobson and Gary J. Whitman
Next, ARRS was proud to recognize two recipients of 2023 ARRS Scholarships: Andrew Wentland, assistant professor at the University of Wisconsin School of Medicine & Public Health, and Steven Rothenberg, assistant professor at the University of Alabama at Birmingham. Provided by ARRS’ own The Roentgen Fund®, the ARRS Scholarship supports early-career faculty members pursuing radiological research that promises to change how medical imaging is practiced. A two-year grant totaling $180,000, the ARRS Scholarship aims to advance emerging scholars, as well as prepare them for positions of leadership.
During the American Journal of Roentgenology (AJR) Luncheon, Sarah Kamel of Thomas Jefferson University Hospital in Philadelphia, PA was honored as the 2023 Melvin M. Figley Fellow in Radiology Journalism, while Ankur Goyal of the All India Institute of Medical Sciences in New Delhi was recognized as the 2023 Lee F. Rogers International Fellow in Radiology Journalism.
Left to right: Ankur Goyal, Andrew B. Rosenkrantz, Sarah Kamel
Also provided by The Roentgen Fund and named for two distinguished Editors Emeriti of the American Journal of Roentgenology (AJR), the Melvin Figley and Lee Rogers Fellowships offer practicing radiologists an unparalleled opportunity to learn the tenets of medical publishing via “the yellow journal”—the world’s longest continuously published radiology journal. Through hands-on experience with ARRS staff and AJR personnel—as well as personal apprenticeship with AJR’s 13th Editor of Chief, Andrew B. Rosenkrantz—Drs. Kamel and Goyal will receive expert instruction in scientific writing and communication, manuscript preparation and editing, peer review processes, journalism ethics, and both print production and digital publication.
2023 ARRS Honorary Member: Jeong Min Lee
Jeong Min Lee
Jeong Min Lee, President of the Korean Society of Radiology, was recognized with honorary membership as part of ARRS’ Global Partner Society (GPS) program. The GPS program was established to build long-standing relationships with key leaders and societies in the global imaging community to enhance understanding, raise awareness, and increase participation in programs and services. The Annual Meeting Global Exchange incorporates one partner society annually into the educational and social fabric of the meeting, with ARRS reciprocating at the partner society’s meeting that year. The GPS partner to be featured at the 2024 ARRS Annual Meeting in Boston, MA, will be the British Institute of Radiology.
John Leyendecker, an astrophysicist at heart, wrote a piece for RadTeams comparing a galaxy to a radiology department. In this blog, he explains how the mass of the stars in a galaxy are not sufficient to hold a galaxy together based on current gravitation concepts. This deficiency in mass led to the theory of dark matter, which is apparently in abundance in the universe although it cannot be detected. Fascinating explanation for one like me who certainly is not an astrophysicist; heck, I barely know any physics, but please don’t tell the ABR. Anyway, without dark matter, galaxies as we know them wouldn’t exist. His analogy is that our radiology departments are like a galaxy with our shining stars (luminary faculty) and dark matter (the rest of us) serving as the glue to hold us together. As strange as all this dark matter stuff sounds, as a department chair, I love the analogy.
His analogy brings to mind the opposite effect upon a department by a faculty member who is a bright star, but for all the wrong reasons. This faculty member is the dysfunctional, complaining, non-worker who takes all the energy and resources of the department for themselves. They are a bright star, but certainly not a shining one. Perhaps using John’s analogy, they are a supernova—exploding and destroying all the surrounding good stuff. Their actions bring out the “dark” aspect of our dark matter faculty resulting in the department coming unglued; even worse is that happy faculty become unhappy. For these people, I like to use the analogy they are that person on a busy highway who is approaching with their bright headlights on. You know there are other automobiles out there, but you can’t see their lights because this one individual is blinding you. But, we have to see those other headlights and make sure they remain visible, otherwise there will be a major traffic accident destroying us all. How is this done? Often people will say that if they could get rid of this person (maybe their car stops working?), then things would be great. However, this is often a fallacy because remember, there are other headlights out there. When you dim one person’s lights, there may well be someone who rises to the occasion and decides to fill the void by turning on their bright lights. So that tactic doesn’t always work. What you do is to flash your bright lights at the person (confront their behavior) and often they respond. And yes, much like in heavy traffic, you may have to flash your lights at them periodically to remind them. In short, the goal is that while there may be a few bright lights out there, you want to make sure they are not blinding lights, and all lights are visible. And much like our universe, this process is somewhat nebulous.
Reginald F. Munden, MD, DMD, MBA
Chair, Department of Radiology and Radiological Science
I once considered becoming an astrophysicist. I abandoned that dream after performing a very brief financial analysis and a realistic appraisal of my mathematical aptitude, but I never lost my passion for the vast majority of the universe that most people ignore. Living in a place where city lights shroud starry nights hasn’t been easy for the astronomer in me, but I’ve found ways to adapt and still enjoy the hobby. Besides, there are valuable lessons to be learned from any pursuit despite (or because of) the challenges.
Few people realize that, when we look at the night sky with the naked eye or even with sophisticated and powerful telescopes, we only see a tiny fraction of the matter that holds our galaxy together. Even when we scrutinize other galaxies with massive telescope arrays in every available bandwidth, we never find enough mass to hold a galaxy together. This discrepancy between a galaxy’s gravitational influence and a galaxy’s visible matter led to the theory of dark matter, a concept that has gained the endorsement of most astrophysicists even though the actual physics remains a bit murky. Without dark matter, galaxies as we know them wouldn’t exist. In other words, those stars that shine so big and bright deep in the heart of Texas would likely be a lot less impressive without the gravitational influence of dark matter. Physicists love particles, and one particle theorized to account for dark matter is called the weakly interacting massive particle (aka WIMP). Now, when astrophysicists aren’t busy telling jokes about Uranus, they are no doubt designing t-shirts that say things like, “WIMPs hold the universe together.”
Like a galaxy, our academic radiology departments have bright stars. We know these stars as the luminaries who are writing papers and textbooks, getting grants, giving lectures around the world, editing journals, and engaging in similar high-profile activities everywhere but where they work.Enlightened leaders know that alone, these stars cannot keep our radiology departments together. Like galaxies, our departments need something akin to dark matter.
Unfortunately, departmental dark matter is as easy to overlook as astronomical dark matter. I’m sure we can all think of someone who inspires and motivates others despite lacking title, reputation, or recognition proportional to their influence. That person is dark matter. If I had to assign such an individual a particle name, I would refer to them as a weakly appreciated massively-influential person (aka WAMP). Just as WIMPs provide the force needed to hold a galaxy’s stars together, WAMPs stabilize our departments and allow our academic stars to shine brighter. They do this by working hard, by projecting a positive attitude, by acting in a collegial and collaborative manner, and by sharing, rather than by hording and devouring, resources.
Radiology leaders adore stars and want to keep them in their departments. Traditionally, leaders have thought that the key to keeping stars is to feed them—more time, more money, more prestige, more recognition, and more resources. But at some point, massive stars evolve into black holes, and the rest of the department suffers. To think that a department can continue to keep the stars without acknowledging and supporting the departmental dark matter is fallacy.
So, the next time you get away from the city lights, look up and remember that, while those big bright stars are pretty to behold, it’s all the stuff that you are not seeing that is really holding our galaxy, and our departments, together.
John R. Leyendecker, MD
Professor and Vice Chairman of Academic Affairs Department of Radiology
Before the COVID-19 pandemic, physician burnout was its own epidemic with radiologists consistently ranking among the most burned-out medical specialties. The acute and now chronic stressors of the COVID-19 pandemic further exacerbated radiologists’ wellness with 54% of radiologists reporting symptoms of burnout, according to the 2023 Medscape report. In addition to radiologists’ wellness, burnout has significant adverse implications on patient care and outcomes.
In its most simplistic dissection, burnout is composed of three parts: depersonalization, physical and emotional exhaustion, and low sense of personal accomplishment. As such, the very fundamental aspect of our job as physicians, that of connecting and communicating with patients, may play a central role in physician wellness. A direct association can be observed between physicians’ level of satisfaction with their job and their ability to build rapport and connect with patients. Rapport and relationship building both decrease depersonalization and increase a sense of personal accomplishment. Although anxiety related to challenging physician interactions, which have been shown to last for days beyond the interaction, can lead to fatigue, if cumulative, these interactions may lead to exhaustion. Furthermore, anxiety surrounding challenging patient interactions, like delivering bad news, is more likely to occur if one is faced with such interactions infrequently, and thus feel unprepared or unskilled to navigate them. Demonstrating the critical impact of patient-physician communication interaction on physician mental health, a recent national study of breast radiologists’ wellness found that less time spent connecting with, educating, and consulting patients was statistically significantly associated with greater odds of reporting psychological distress and anxiety. Interestingly, although increase in frequency of more negative and charged patient interactions were reported by some radiologists in the study, no association between negative interactions and mental health was found. It thus appears that it is the length of time allotted for physicians to build rapport and make meaningful connections with their patients to educate and inform, rather than the nature of the interactions themselves, which significantly affects radiologists’ wellness.
As institutions, practices, and individual physicians devise strategies for burnout mitigation, time and adequate focus should be allotted to patient-centered communication. Operational leadership should be intentional in incorporating sufficient time for radiologists to discuss results and consult with patients into the daily workflow, not limiting interactions in favor of increased volume. Communication skill training should be increasingly integrated into radiology training curricula. In addition, training and effective communication skill resources should be emphasized and made readily available for all faculty to equip radiologists with the confidence to approach a variety of challenging patient interactions, thus diminishing communication-related anxiety. Radiologists themselves should emerge from behind the workstation, seeking out opportunities to consult and educate patients—as our very own wellbeing depends on it.
Wellness at work starts with processes that improve your life, not impede it. Making your job something you look forward to, not dread. The first step is identifying what at work is leading to stress and unhappiness.
These can be big things, such as we need more staff to cover calls, or small items, such as moving the cutoff time to read cases from 5:00 to 4:30 pm. The hard part is that these changes are extremely practice-specific. What has helped in my practice is likely to be irrelevant to someone else’s. Therefore, it is critical that leadership listen to radiologists and be willing to make changes. There is no one-size-fits-all, and no one outside your practice can tell you what to do. So, it all starts with identifying pain points, and then getting leadership to listen and be willing to change.
Darcy J. Wolman, MD
Johns Hopkins Medicine
In “Words of Wellness” on www.radfyi.org/, members of the ARRS Wellness Subcommittee share what “wellness” and “wellbeing” mean in their own clinical practices, research focuses, and everyday lives.
Dr. Wolfman’s ARRS “Sound of Wellness” Playlist Selection: